
Monitor metrics now available in the v3 API
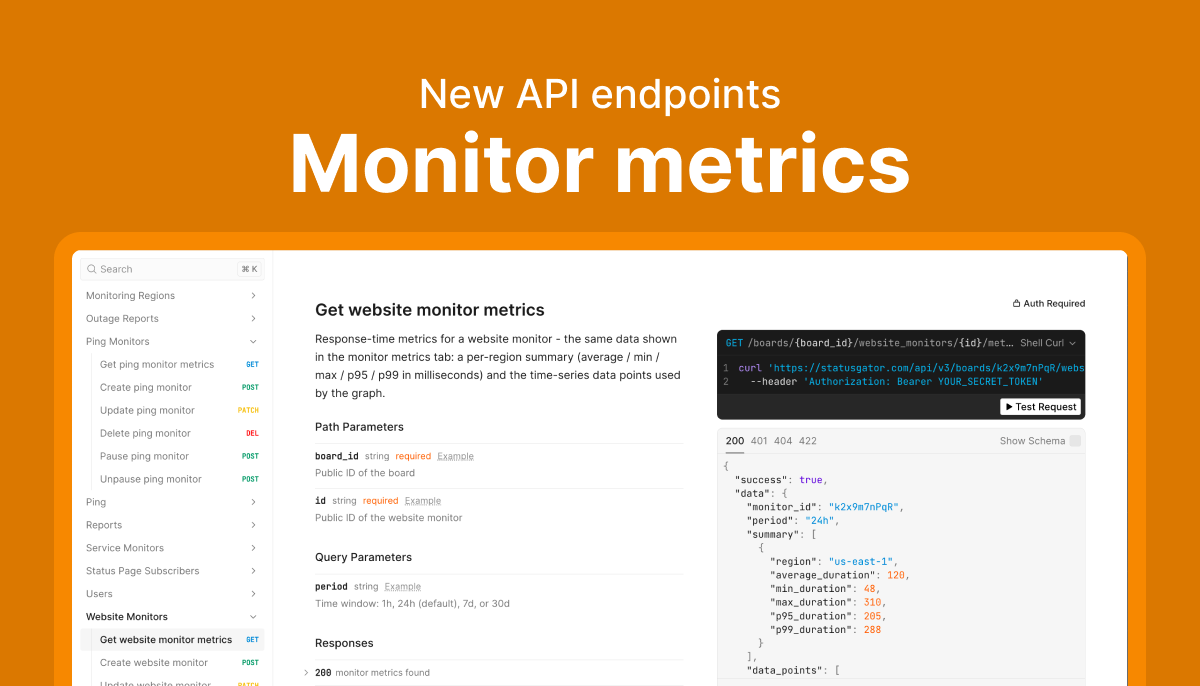
Monitor metrics are now available through the StatusGator v3 API and MCP server. Access latency summaries, p95/p99 performance data, and time-series metrics for Website and Ping Monitors to power integrations, automations, and AI-driven incident investigations.

StatusGator expands global monitoring coverage with new regions in Mumbai, Tokyo, and Singapore

StatusGator website and ping monitors now support Mumbai, Tokyo, and Singapore. Improve APAC coverage and gain deeper insight with multi-region monitoring.

Faster monitor metrics and new response time stats
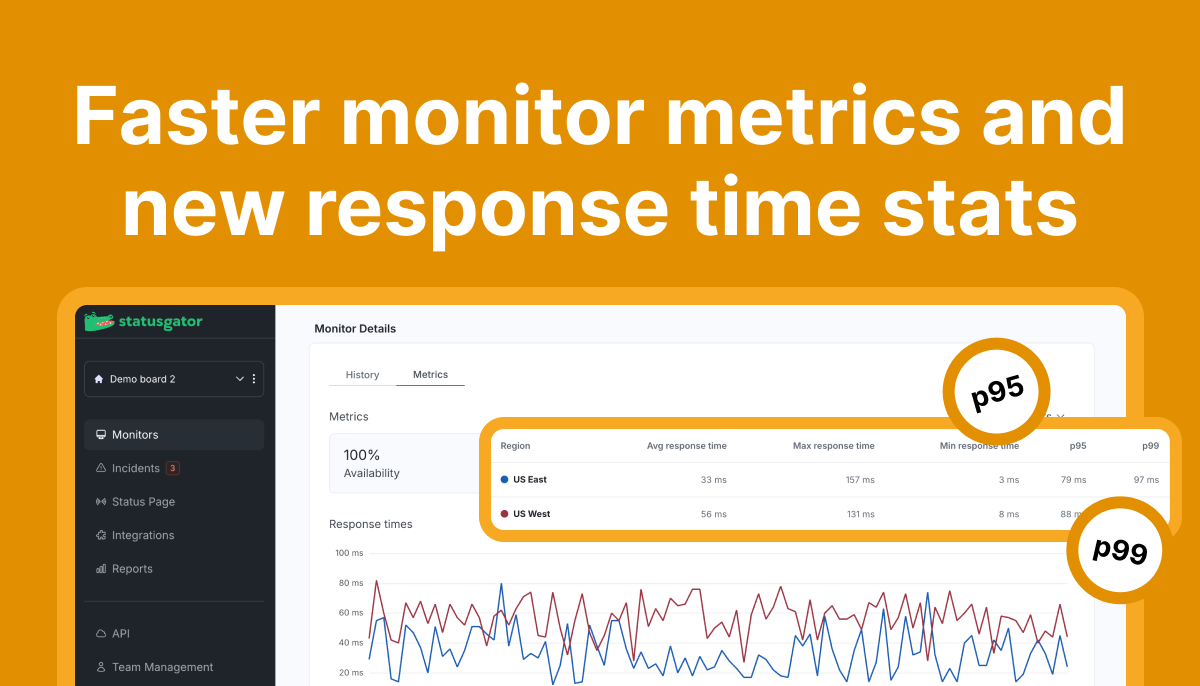
Monitor website and ping performance more efficiently with faster-loading metrics graphs and new p95/p99 response time statistics in StatusGator. Gain deeper visibility into latency spikes and response time consistency directly from the Metrics tab.
Now available: More monitor history

View website and ping monitor metrics across extended time ranges, including hourly, weekly, and monthly performance data.
New! Website and Ping monitor metrics

Track website and ping monitor performance with the new Metrics tab in StatusGator! Get real-time insights on availability, downtime, and response times across regions.
Fine-tune notifications with Alert sensitivity

Take control of your website and ping monitor alerts with Alert sensitivity.
Monitor status and name now visible on the configuration page

View monitor status and names directly on the configuration page in StatusGator. Simplify setup and manage your monitors with ease in one convenient view.
“Check Now” for instant status updates

Instantly check your website or ping monitor status with the new Check Now feature. Access it from the Monitors page for real-time updates whenever needed.
Introducing Ping Monitoring in StatusGator

We’re excited to announce a new addition to StatusGator’s robust monitoring suite: Ping Monitoring. ...


