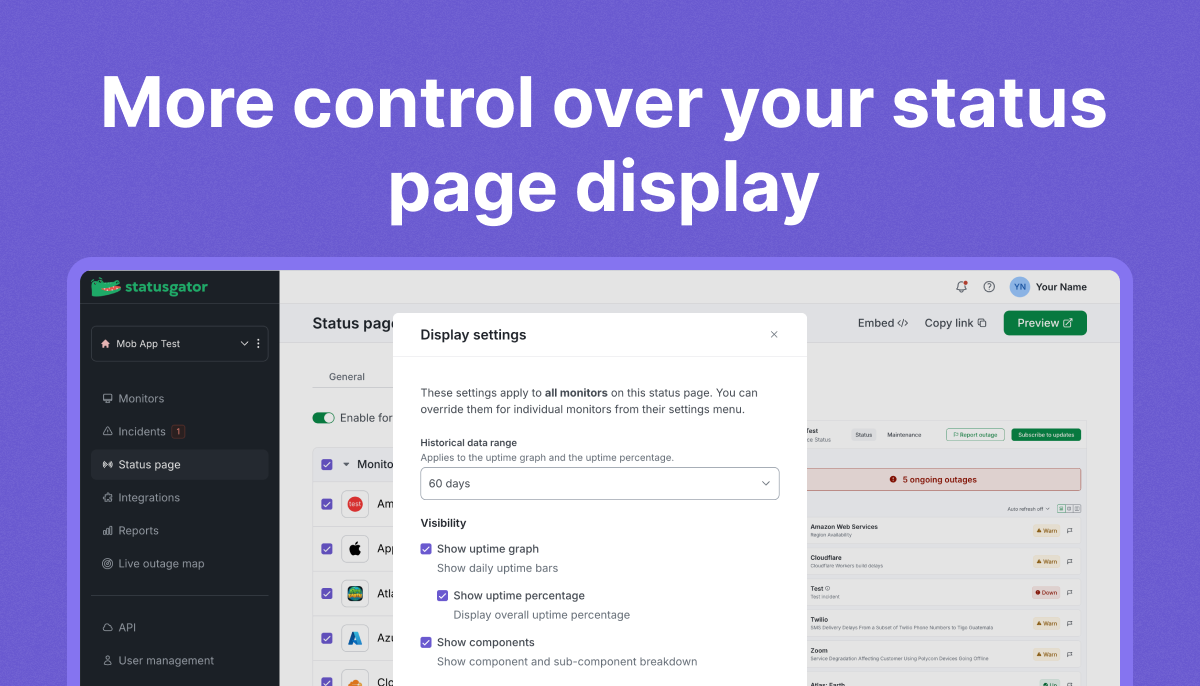
You can now customize how monitor details appear on your StatusGator status page. New display settings let you choose how much uptime history to show, which details are visible, and whether monitors start expanded or collapsed.

Choose your uptime history range
Select 30, 60, or 90 days of historical data. This setting applies to both the uptime graph and the uptime percentage, so you can focus on recent performance or give visitors a longer view.
Control which details appear
Show or hide:
- Uptime graph: Daily uptime bars for the selected period.
- Uptime percentage: Overall uptime percentage for that period.
- Components: The component and sub-component breakdown.
These controls help you tailor your page to your audience, from a simple status overview to a more detailed view of service reliability.
Set the default view
Choose whether monitor details are expanded or collapsed by default when visitors open your page. Expand them to make uptime and component information immediately visible, or keep them collapsed for a compact overview.

Apply defaults or customize individual monitors
Set display defaults for all monitors on your status page, then override them for individual monitors as needed.
To get started, go to Status page → Monitors → Display settings. To customize a specific monitor, click the gear icon next to it and uncheck Use default display settings.
Open your status page settings and choose the view that works best for your audience.