One of our most requested features has made StatusGator more useful than ever before.
StatusGator has been monitoring hundreds of status pages since 2015. Currently, the number of services that users can display on their product or application status page is more than 2,800 vendors. Our aim has always been to aggregate the published status of the cloud services you depend on, making it available in any format you need, and notifying you when it changes.
Status pages have now become an essential tool for most cloud companies and SaaS services. As their popularity has proliferated, so has the detail made available on them. Many status pages are now broken down with line item details, showing the status of individual services offered by a company. Sometimes those services are grouped together in regions or other sections of a page, providing even more helpful organization.
Several months ago, we began monitoring these line items individually, recording the status of each every time we checked a page. We call them components and each component has a name and a group name. Every time the page is checked, we find the component in our list and update its status to reflect what the page displays. If a new component is added, we add it to our list. If a component is removed, we remove it from our list. All of this happens automatically and seamlessly every 5 minutes, the frequency at which we check all status pages in StatusGator.

Component Notification Display
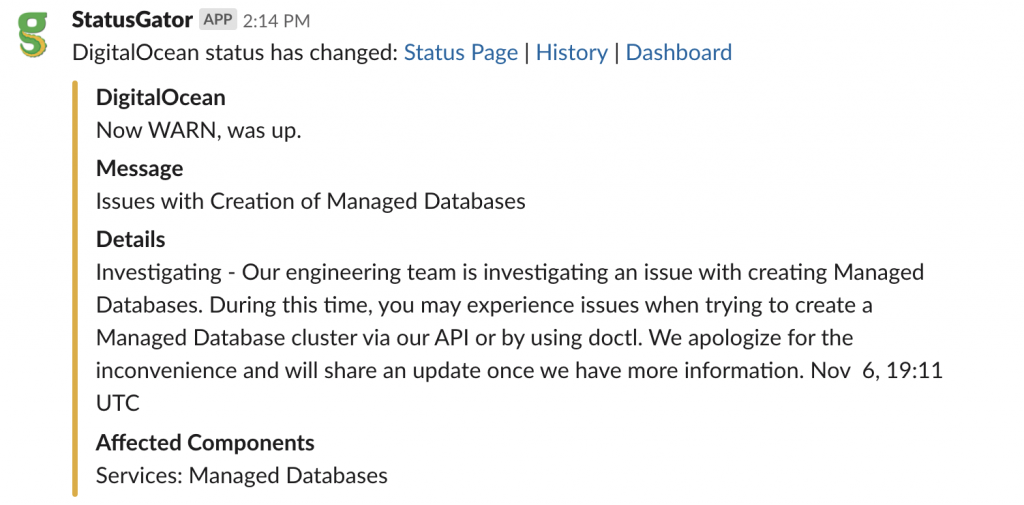
We have been hard at work updating StatusGator to ensure the most popular status pages support component statuses. We’re proud to announce that we have now achieved 87% coverage of component status across all StatusGator subscriptions and have begun exposing individual component statuses in notifications via Slack and Email:
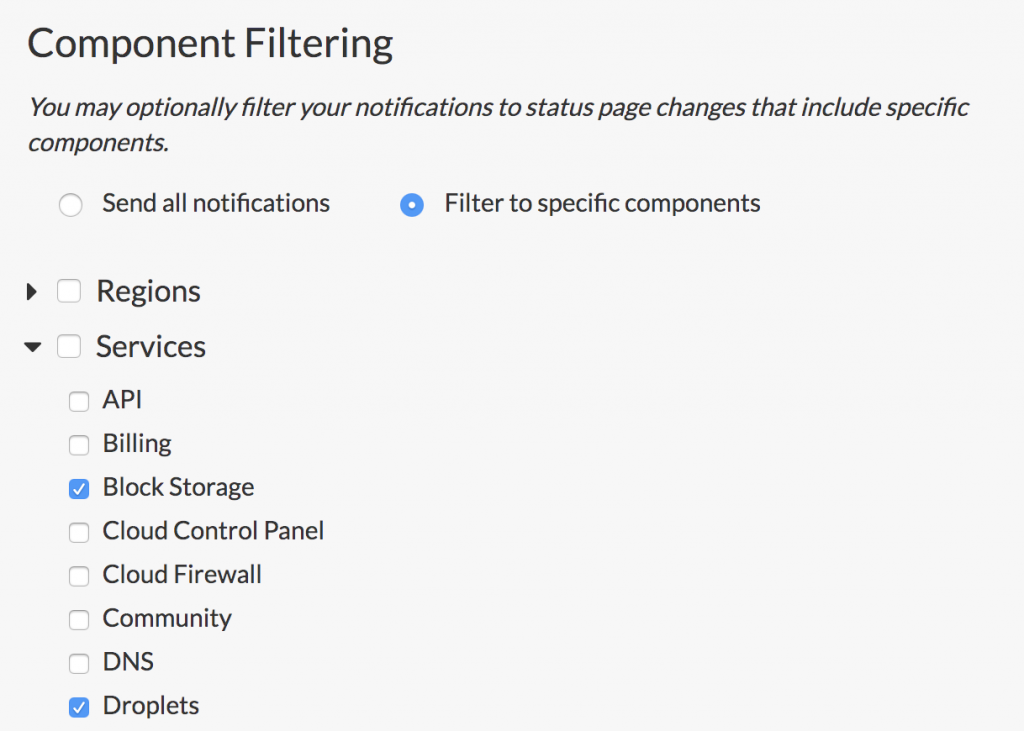
Filtering Notifications to Specific Components
But the usefulness of components isn’t limited to exposing their status in notifications. The real power comes from being able to filter notifications about a service to only those status changes that include components you care about. That feature is now available on all our plans.
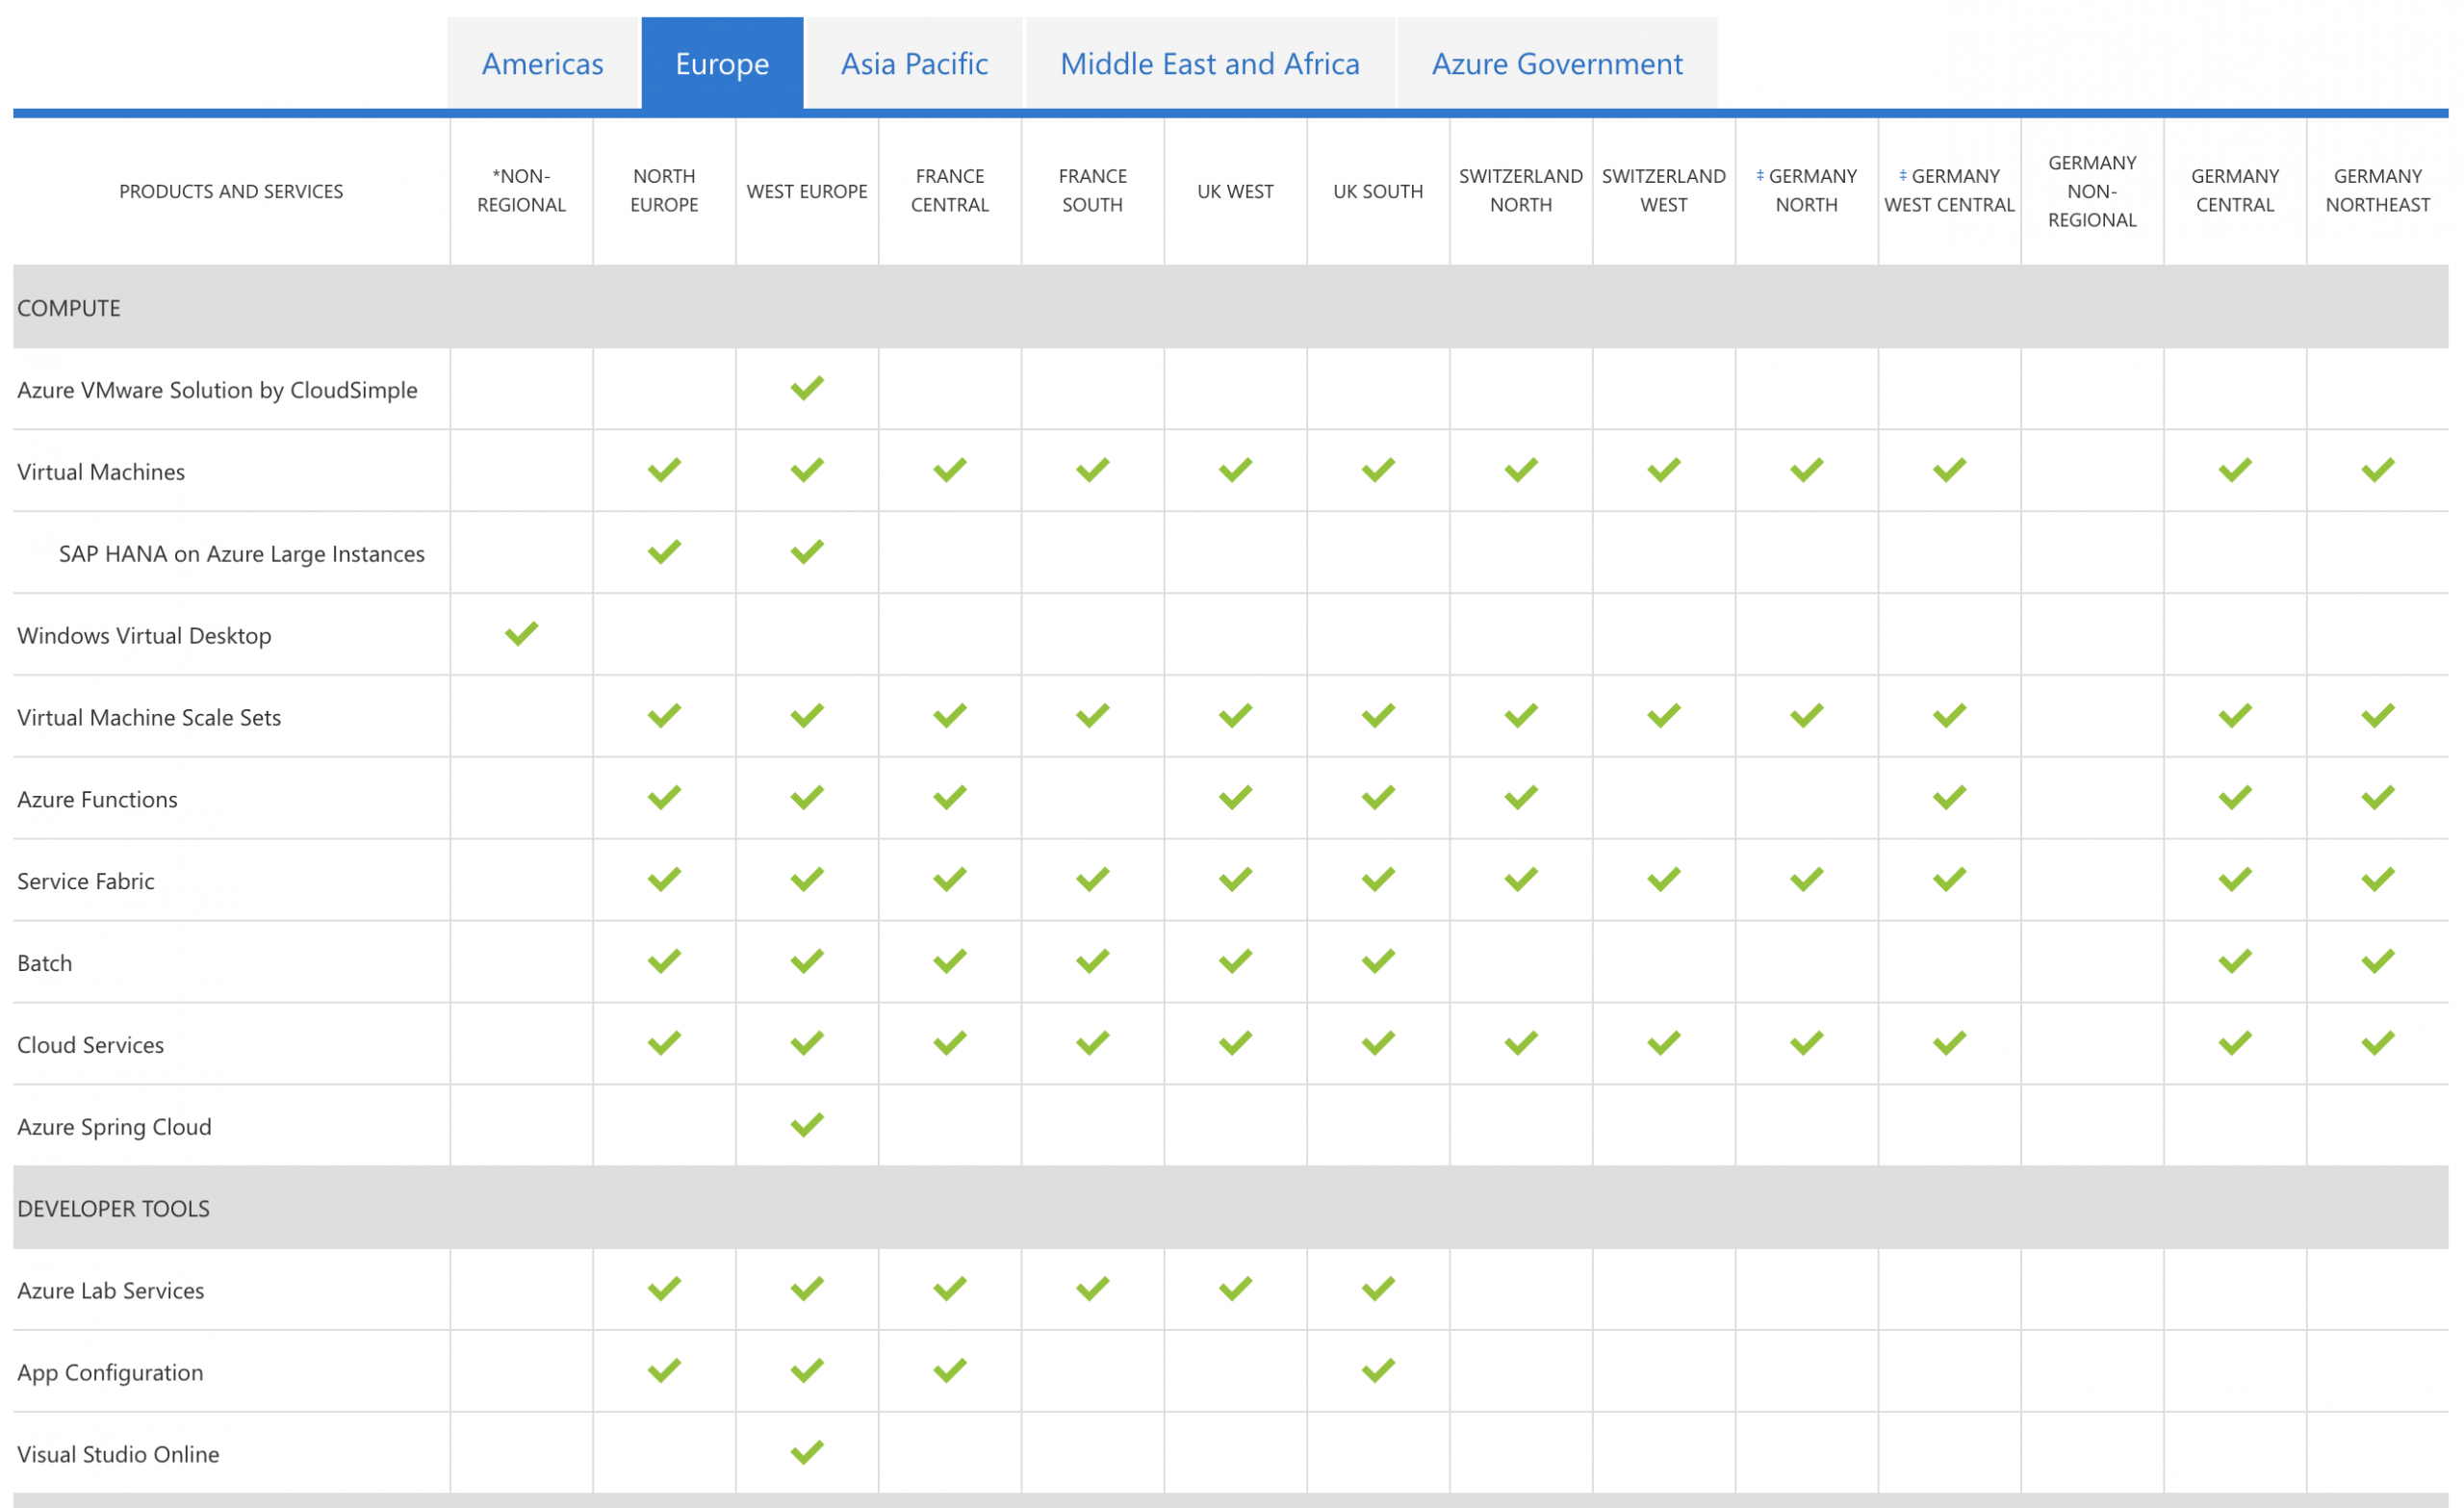
The usefulness of component statuses is obvious when you consider the status pages of the major cloud providers. StatusGator monitors the Microsoft Azure status page which has 3,055 components (and growing), the most of any status page we monitor. The most popular page monitored on StatusGator, the Amazon Web Services status page has 1,682 components divided among 19 regions. Most typically, an AWS customer uses a few or perhaps a dozen of these components and cares little about the status of services they don’t use in regions they don’t operate. Now, StatusGator users can get notified only when an AWS outage affects the components they depend on.
Even smaller status pages with fewer components can gain new usefulness with component status filtering. For example, Shopify, another popular status page, displays the status of their support portal on their status page. Although the transparency is admirable, most Shopify users do not need to be bothered by notifications about an outage of Shopify’s support portal. With component status filtering, StatusGator users can easily filter those notifications.
Try Component Filtering Today
With this new feature, we have also added a free trial period to all new accounts. When you sign up for StatusGator, you’ll be able to enjoy all the features, including component status filtering, free for 30 days. No credit card is required for signup. We are confident you’ll love the unified status dashboard, Slack and webhook integration, and improved transparency you’ll get with StatusGator’s status page monitoring.

As always, we thrive on your feedback. Please email us with your suggestions, comments, bugs, or new status pages we should be monitoring.