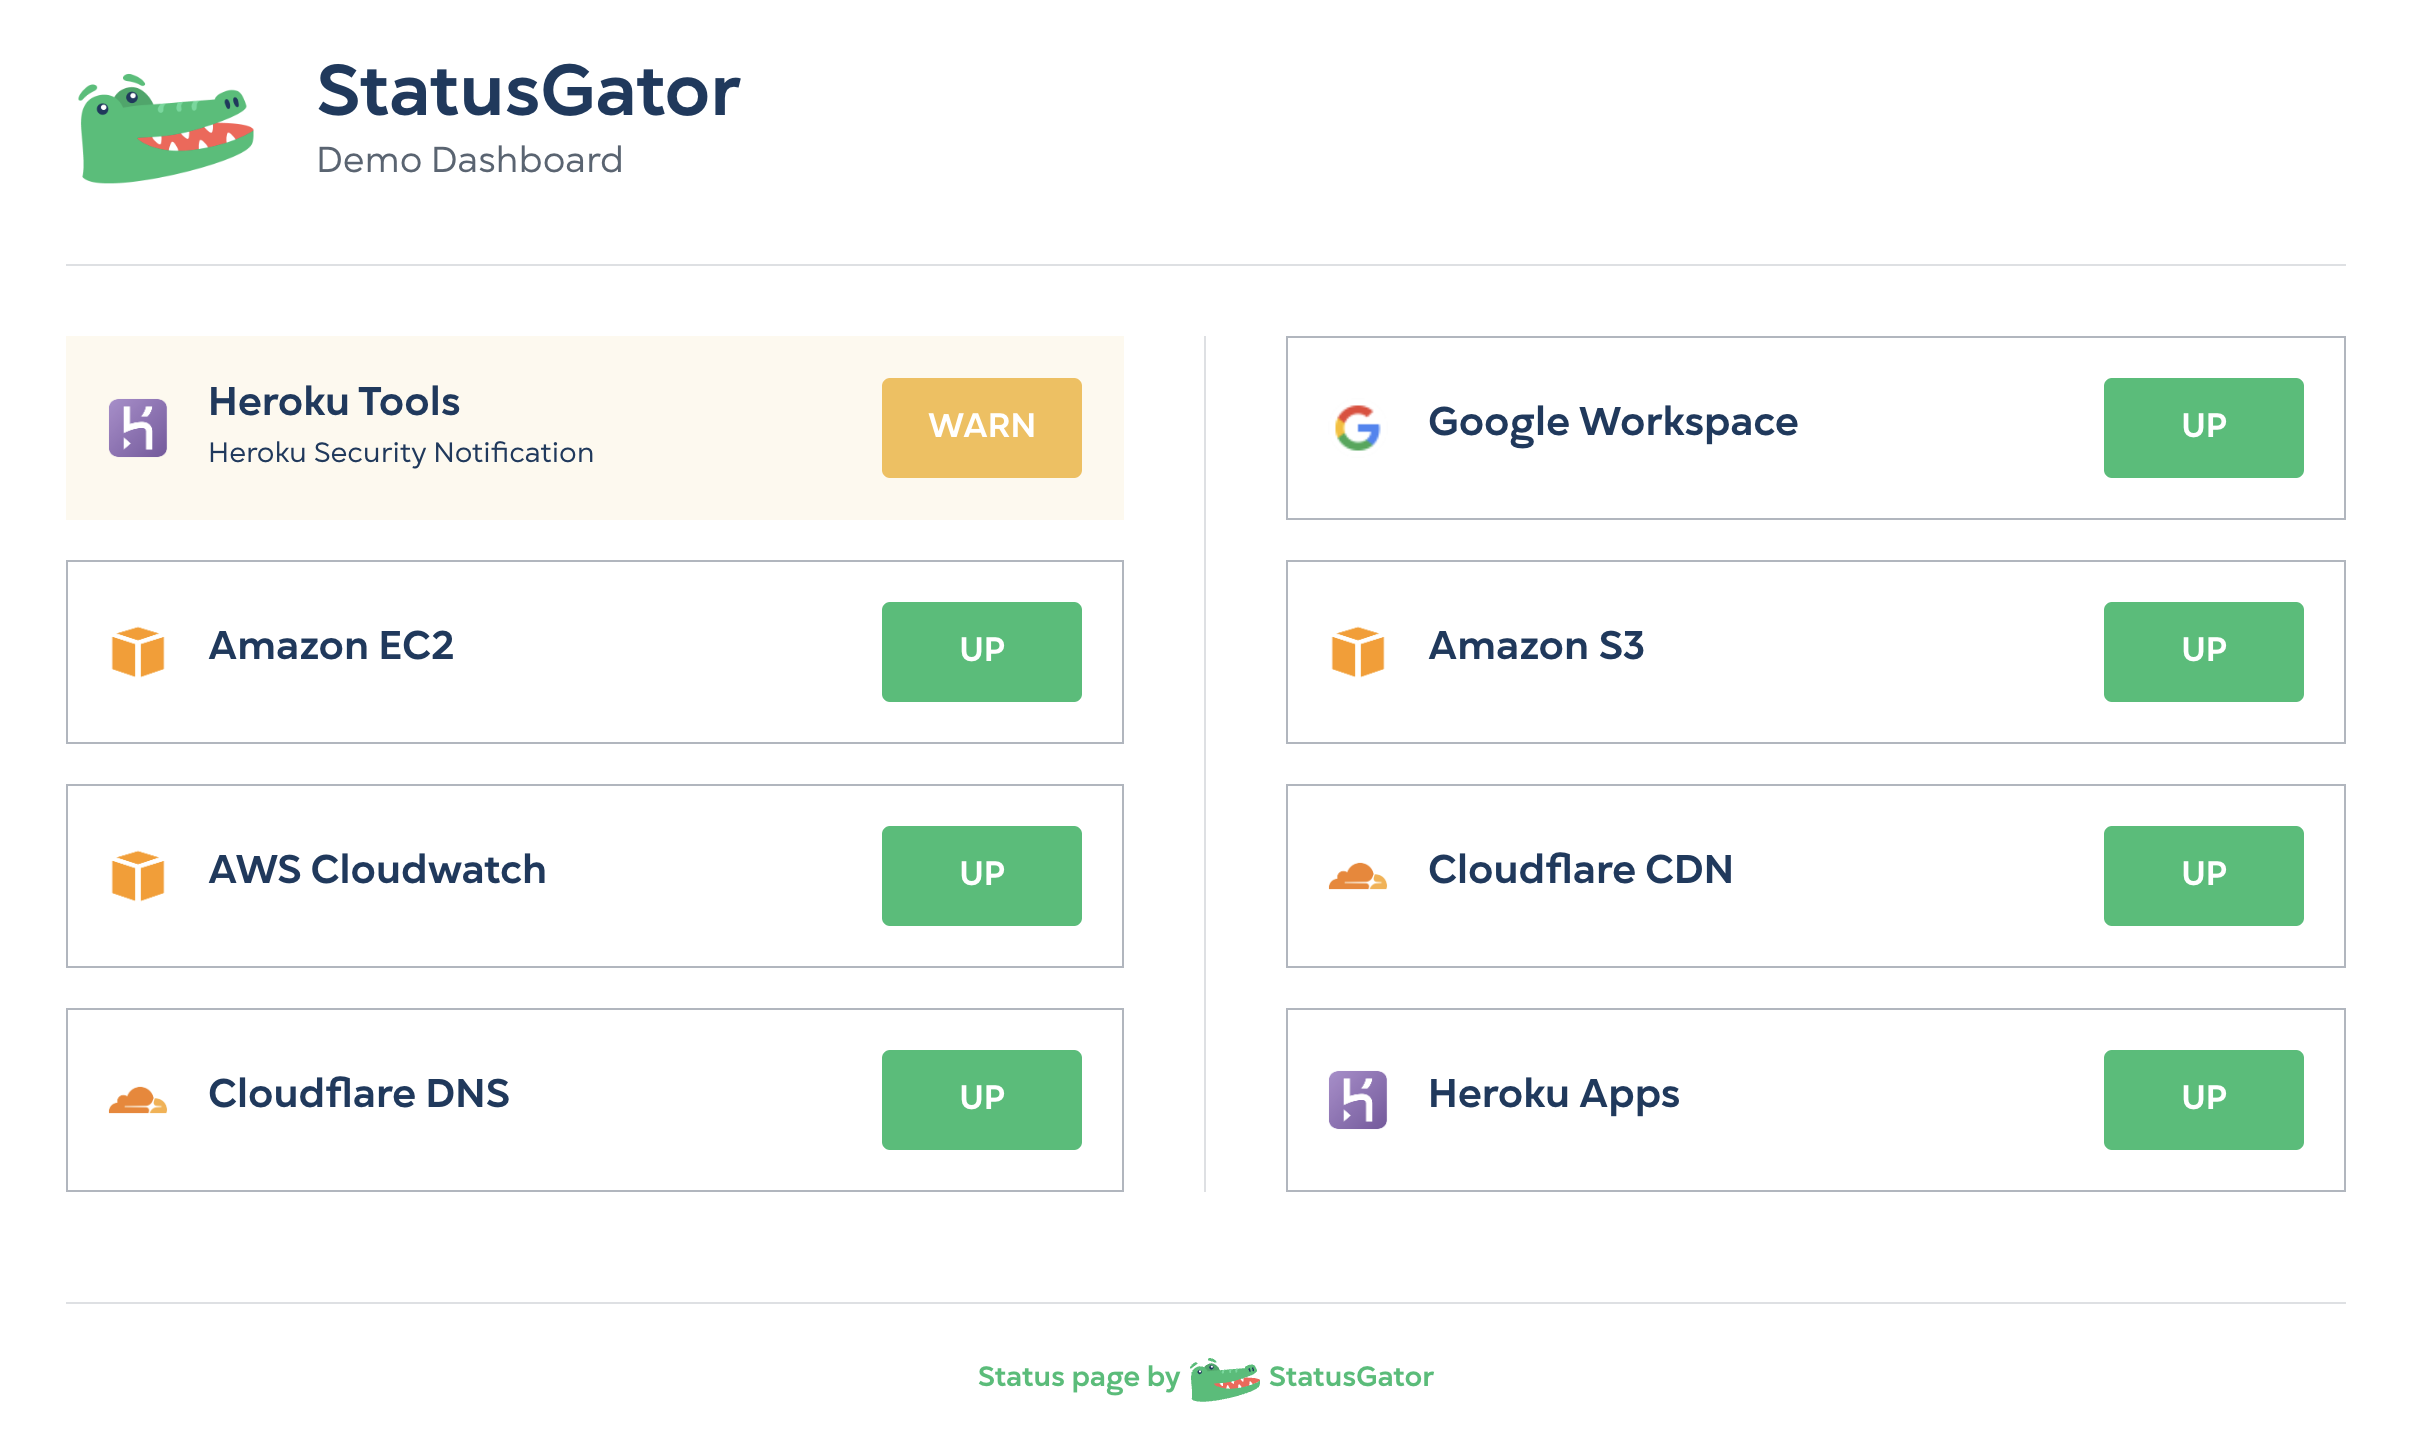
StatusGator is a status data platform: We ingest data from more than 2,800 services by extracting and normalizing their official, public status page information. To monitor a service, you simply search through our list of thousands and add it to your status page. From there, you can filter to specific components of a service, such as products or regions.
Now, you can subscribe to the same service more than once on a single StatusGator status page. What does this mean in practice? It means that individual components, products, regions, or features of a given service can be displayed separately on your StatusGator status page, in notifications, and on your status page.
This feature can be used for any service but is most useful for services that have a large surface area or disparate products under a single umbrella. For example, the most popular service monitored on StatusGator is Amazon Web Services. With thousands of services and regions, you might wish to display specific items separately on your StatusGator status page. Now you can:
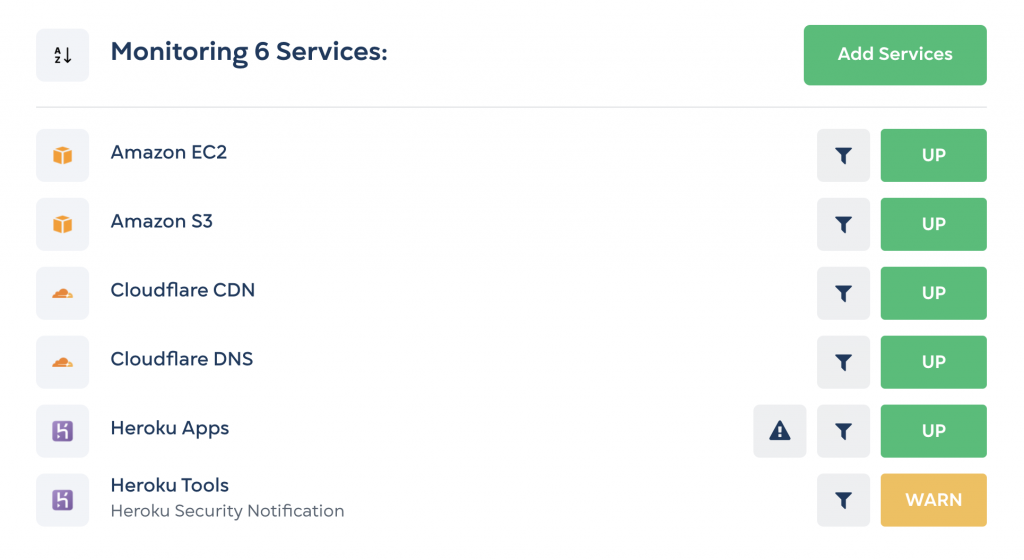
To configure your status page in this way, simply search and add the service a second time using the Add Services button at the top of your status page. The service will be added to your dashboard a second time:

Next, click the filter icon and choose which components, products, or regions you wish to filter this specific line item to:
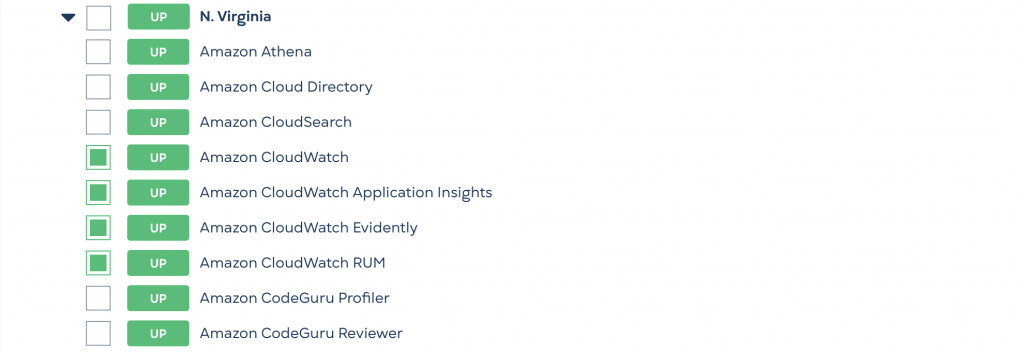
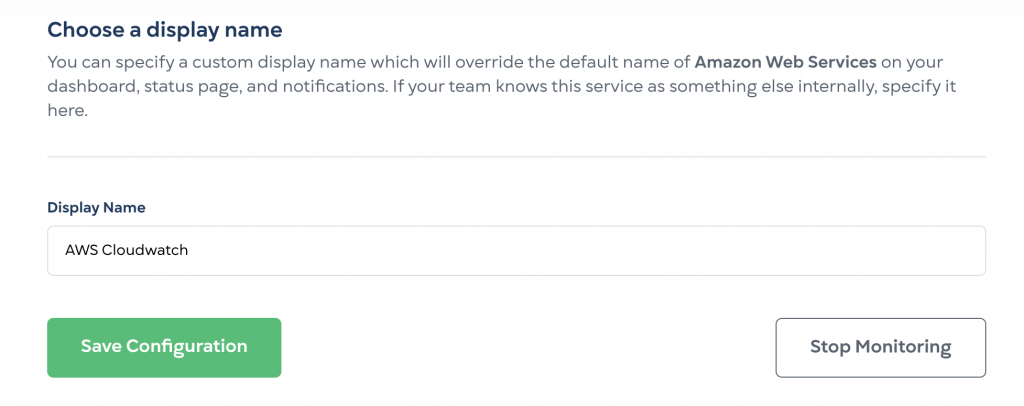
Enter a Display Name that reflects how you wish this set of component filters to be displayed on your status page and click Save Configuration.
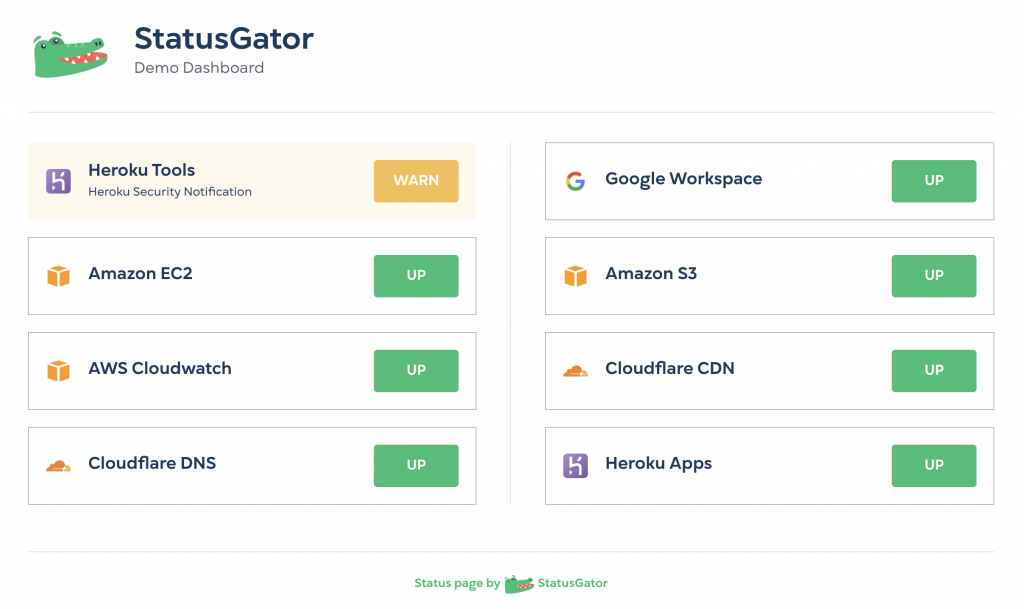
If you’re on a plan with a public status page, then it, too, will show your separate, more granular status detail as well. These public status pages are perfect for sharing the status of your vendors with your team or stakeholders.
We’d love to know what you think of this feature. Useful? Needs improvement? Let us know!