It’s no secret that status pages are an effective way to keep your customers informed.
They efficiently inform users of any downtime or incidents disrupting the company’s service. By displaying this status information, your transparency as a business greatly improves. Without a status page, users are left in the dark. Support tickets pile up, distrust begins to grow, and your users can eventually see you as unreliable.
That’s why having a status page is essential for a business in 2025. By showing your current status and incident history or previous downtime, you can keep your users in the loop. This keeps your support team free of numerous reports for a single issue.
That said, making the right status page can be tricky. What information should you include? Can it be tailored to your brand? What is an example of a good status page?
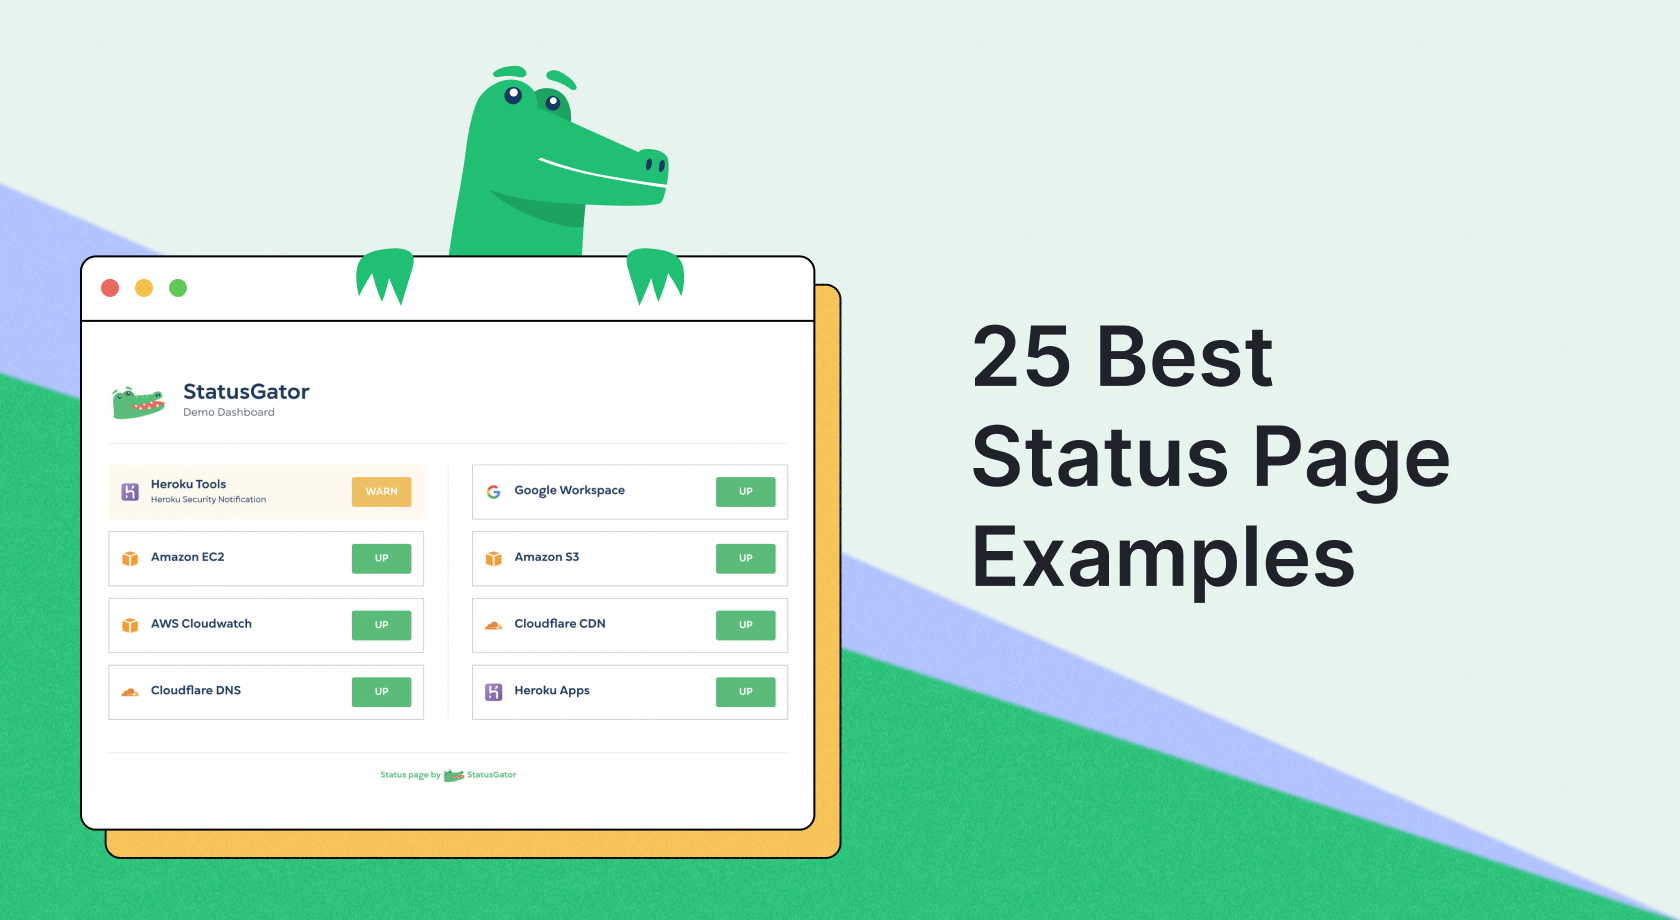
We want to answer these questions by examining the 25 best status page examples in 2025. By adopting some of the communication practices we highlight in these examples, we’re sure you can make the best status page for you.
Do you want to make a clear, informative, and great status page for your business? Let’s jump straight in and look at some great status page examples.
What Status Page Examples Are We Looking At?
In this article, we review a variety of businesses to establish what makes a good status page. For example, a status page for a SaaS company would not always work for a K12 school’s status page. As a result, we considered different use cases and gathered status page examples from a variety of services and areas, including:
- Education
- SaaS and Software
- Community and Communication
- Fintech
- E-commerce
Our List – Best Status Page Examples in 2025
Education
- Portland Public Schools
- University Systems of Georgia
- Harvard University
- Massachusets Institute of Technology (MIT)
SaaS and Software
- TrackSSL
- Quickbase
- Datadog
- Amazon Web Services
- DigitalOcean
- Docker
- Heroku
- Cloudflare
- Segment
- Twilio
- GitHub
- Litmus
- NoCodeOps
Community and Communication
Fintech
E-commerce
Education Status Page Examples
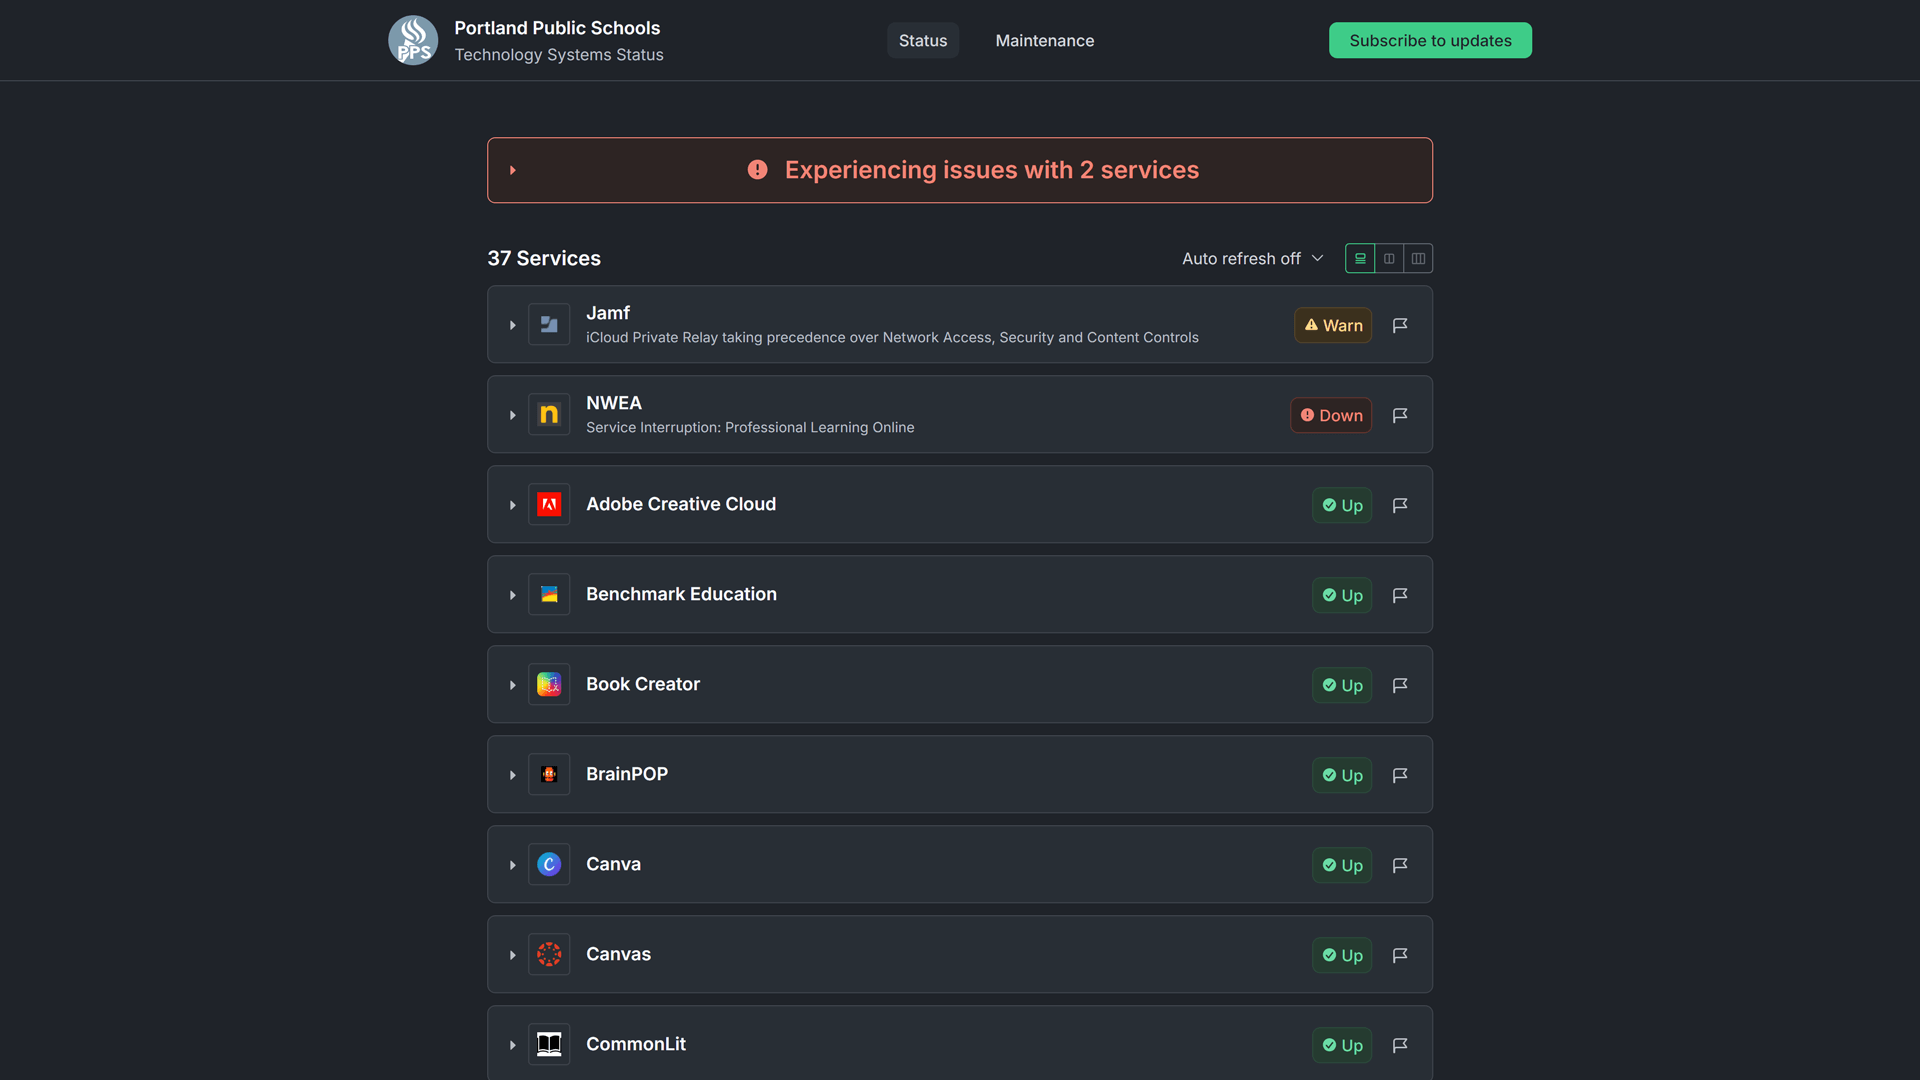
1. Portland Public Schools
Status Page: https://status.pps.net/
What They Do: They are a public school based in Oregon, USA. Portland Public Schools primarily relies on third-party services. It includes a few Learning Management Systems (LMSs) such as Canvas, Seesaw, and Nearpod. They also rely on different Content Management Systems (CMS) and communication platforms.
What’s Great About Their Status Page? All the statuses of the third-party services they rely on (31 in total) are aggregated into one single status page. Whenever a disruption occurs, automatic notifications are sent to any assigned groups or subscribers. There is immediate communication between all parties. There is no need for the IT staff or school admin to inform teachers and school staff.
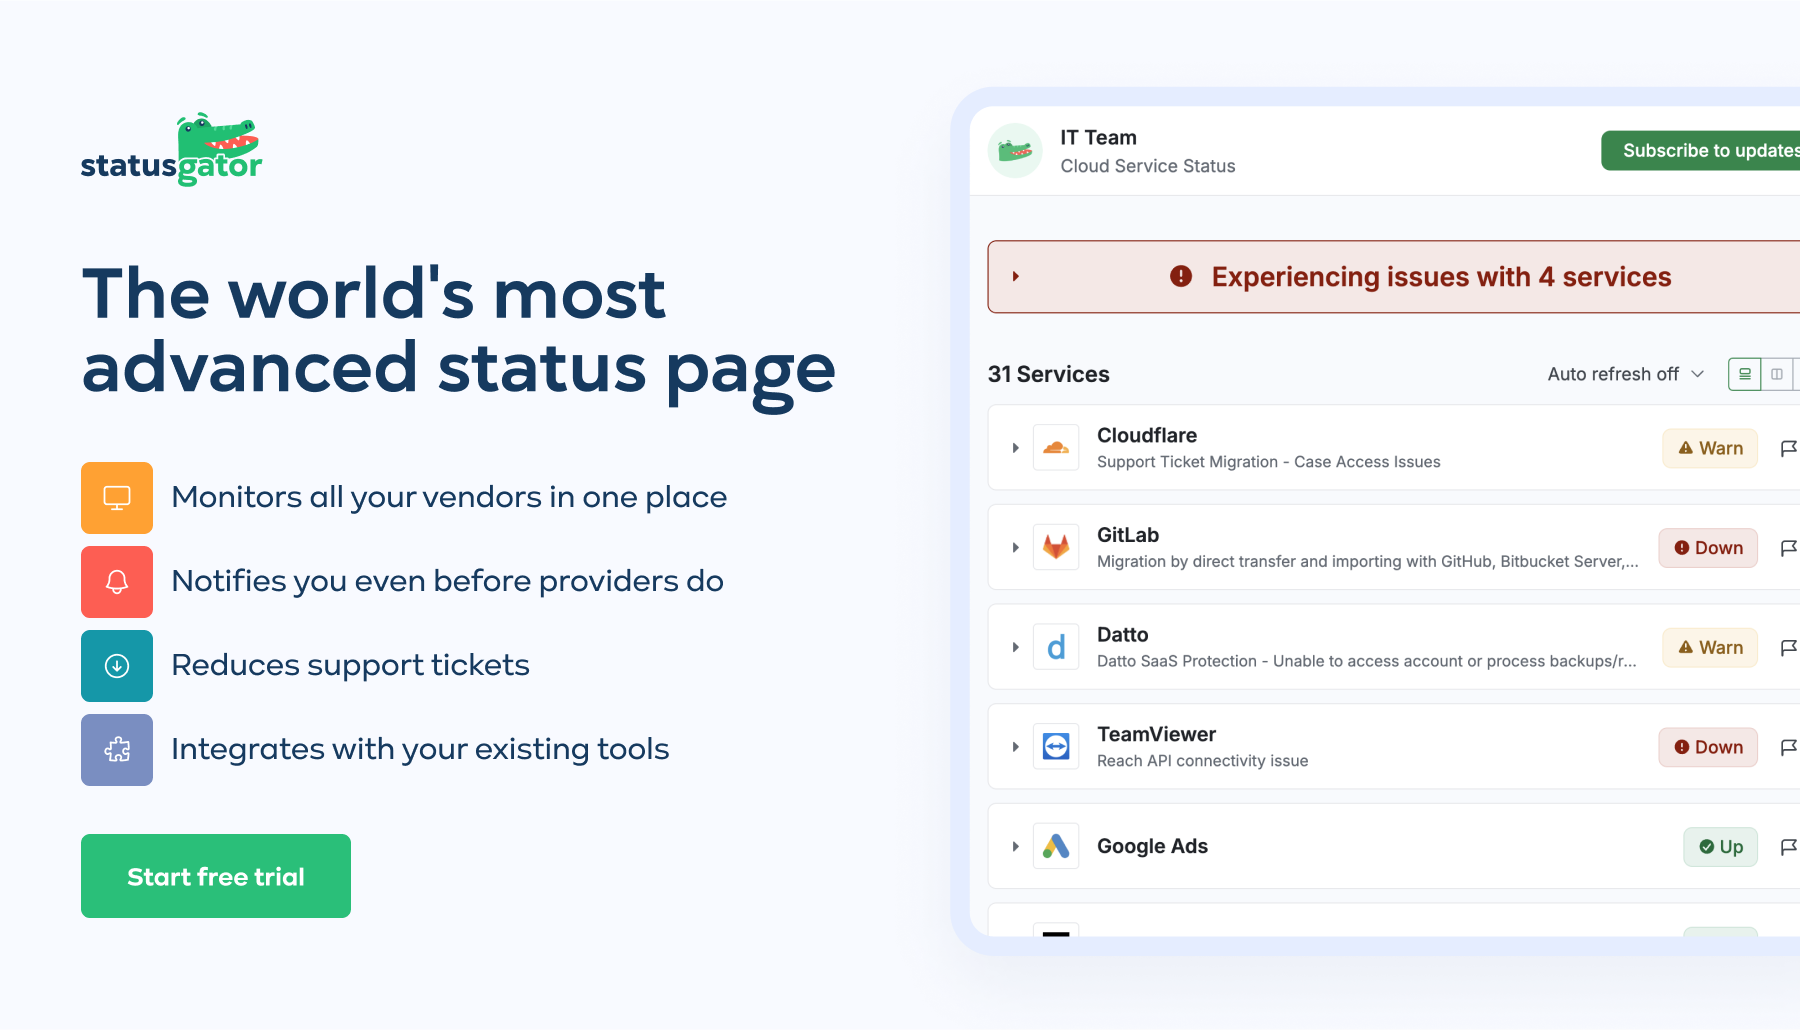
They do this using StatusGator. StatusGator is a versatile status page provider designed to help organizations communicate effectively during incidents. By offering comprehensive status page solutions, StatusGator ensures that all stakeholders stay informed with instant updates, promoting transparency and trust.
Key Features and Values of a Status Page for Incident Communication
- Public and Private Status Pages: Create dedicated status pages for both public audiences and internal teams. Public status pages keep customers informed, while private pages ensure that your internal teams have the information they need to respond quickly.
- Customizable Status Pages: Tailor your status pages to reflect your brand with options to customize logos, favicons, and domains. This ensures that your status page aligns with your company’s identity and enhances your professional image.
- Third-Party Monitoring: StatusGator monitors over 4,000 cloud services and SaaS providers, aggregating their status information to provide a comprehensive view of potential external disruptions.
- Early Warning Signals: Every 60 seconds, StatusGator analyzes real-time data from thousands of sources to detect anomalies in service performance. This enables early alerts about potential disruptions in your dependencies, giving your team more time to respond effectively.
- Website and Custom Monitoring: Beyond third-party services’ status, StatusGator allows you to monitor your websites and create custom monitors for unique incidents. This flexibility ensures comprehensive coverage of all potential issues.
- Real-Time Notifications: Keep all stakeholders informed with instant notifications through various channels like Slack, Microsoft Teams, email, SMS, webhooks, and API integrations. This ensures timely updates and reduces uncertainty during incidents.
- Status Widgets and Embed Options: Integrate status information directly into your website or intranet using customizable widgets and JavaScript or iframe embeds. This makes it easy for users to access the latest updates without leaving your site.
- TV Integration: Display your status page on office TVs to keep your team continuously updated on the status of your services and systems, fostering a proactive incident response environment.
Benefits of Using StatusGator as a Status Page Provider
- Enhanced Transparency and Trust: By providing clear and consistent updates during incidents, StatusGator helps build trust with customers and employees, enhancing your organization’s credibility and reputation.
- Improved Incident Response: With real-time notifications and centralized status information, your team can respond to incidents more quickly and effectively, minimizing downtime and disruptions.
- Reduced Support Tickets: Proactively communicating incidents and updates reduces the volume of support tickets, allowing your support team to focus on resolving issues rather than fielding inquiries.
- Comprehensive Monitoring: StatusGator’s ability to monitor thousands of third-party services ensures that you are aware of any external factors affecting your operations, enabling proactive incident management.
- Seamless Integration: With multiple integration options, StatusGator fits into your existing workflow, making it easier to manage incident communication without disrupting your processes.
If a service is experiencing an issue, viewers of the Portland Public School’s status page can expand the service tab. This lets them view a particular component of that service or its critical dependency. For example, if there are ongoing issues with numerous AWS Regions inside of the Canvas LMS.
Using StatusGator as your status page provider ensures that you can handle incidents with greater efficiency and clarity. This keeps all stakeholders informed and confident in your response capabilities. As a result, their status page is clear and informative, with a straightforward design and useful page attributes.
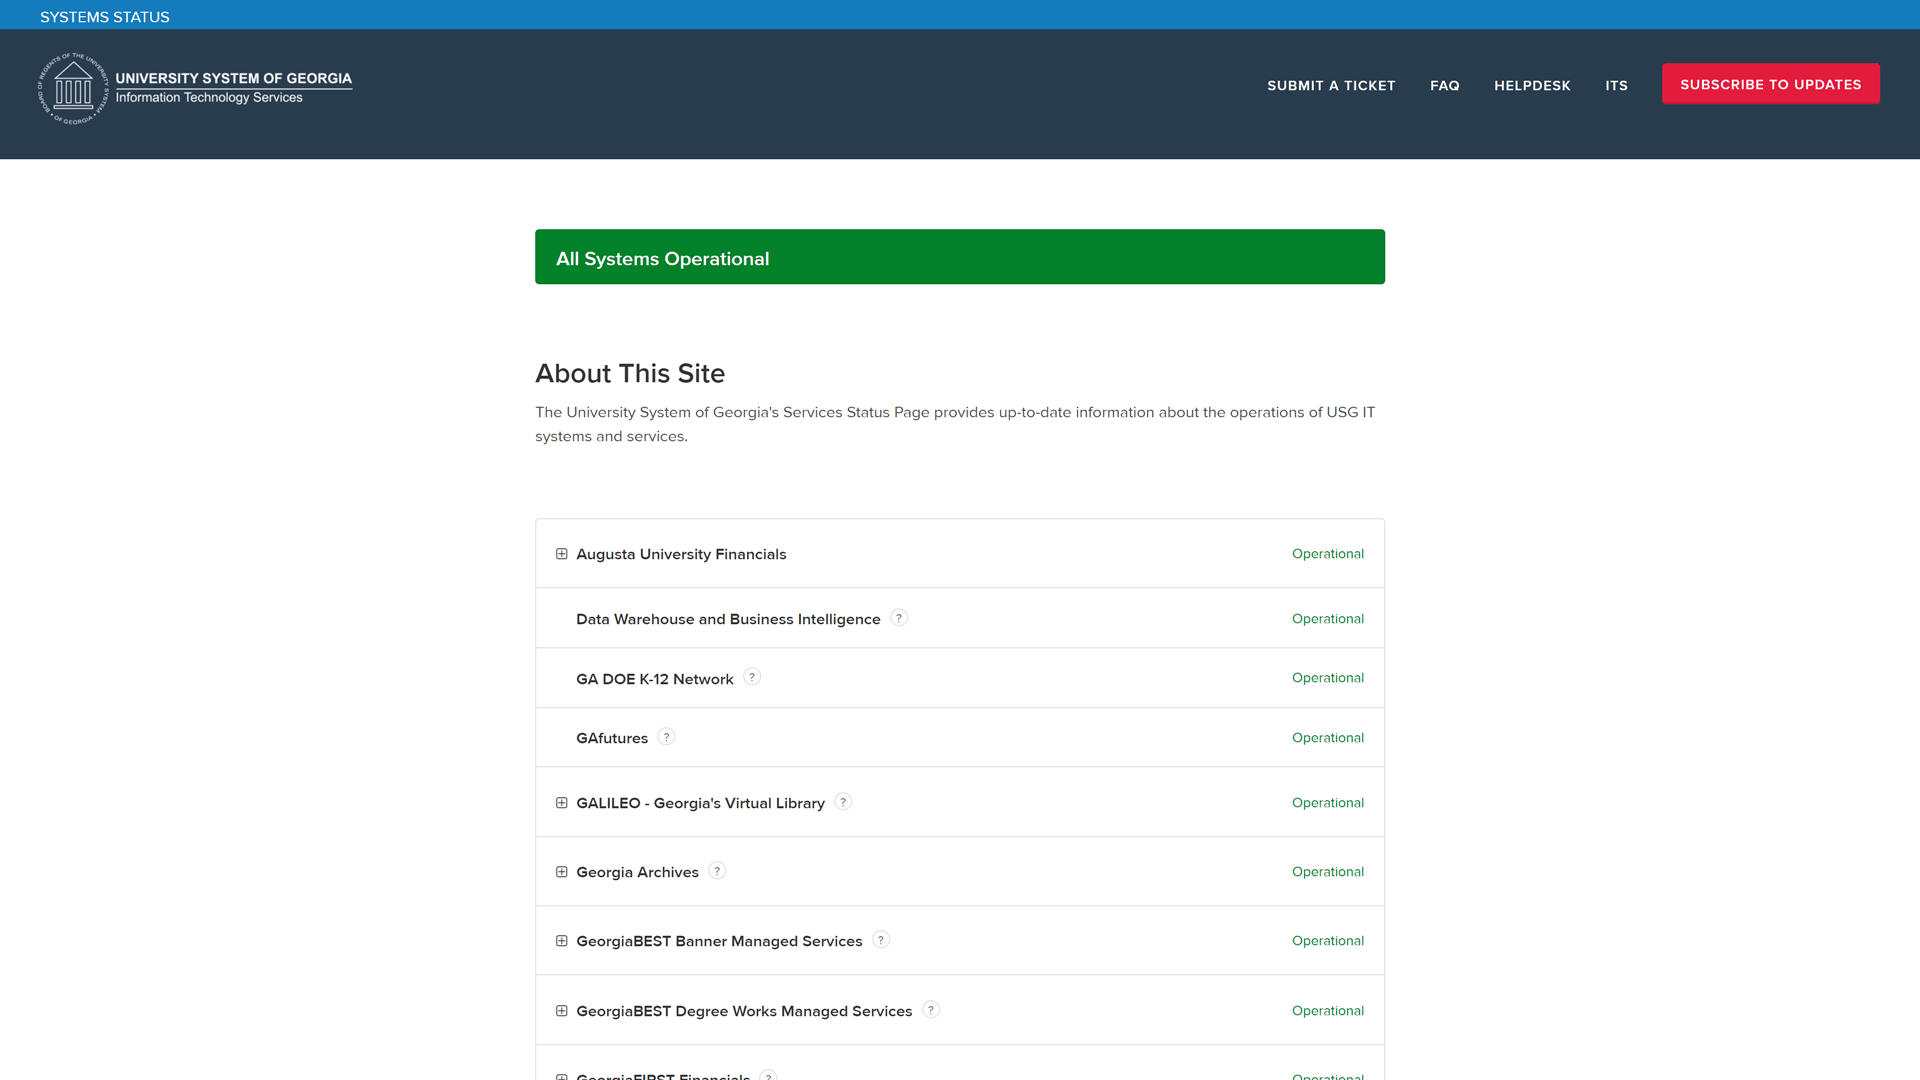
2. University Systems of Georgia
Status Page: https://status.usg.edu/
What They Do: They are a public university system based in the US State of Georgia. They include 26 educational organizations including colleges, universities, the Georgia Archives, and the Georgia Public Library Service. This covers over 300,000 students in the state of Georgia.
What’s Great About Their Status Page? USG aggregates all the statuses and components of all the educational organizations in Georgia into one place. It saves time for students, applicants, and staff. Users can find out about any issues for the specific organization or service.
Their status page also covers many system components and attributes. All these components have icons explaining what they are to make navigation easier for users. Each component has a dropdown icon for users to see individual sub-components.
A subscribe for updates button is available. Also, FAQs and a button to submit an IT ticket are clear and accessible at the top of their status page. A 2-week incident history is available, with lots of information. However, a timeline of incident history extending past 2 weeks would be beneficial for transparency.
There is an overall lack of a color scheme to lighten up their page. Typically, Atlassian status pages allow color or a banner. USG could take advantage of this feature and bring in some color to separate incidents, downtime, and maintenance. Currently, they only have green for operational and orange for issues.
Overall, their status page is informative for students to find out why they might be experiencing issues. However, the visual aspects of their page could be improved to provide an instant hint with the help of a color scheme. Additionally, an extended incident history would be beneficial.
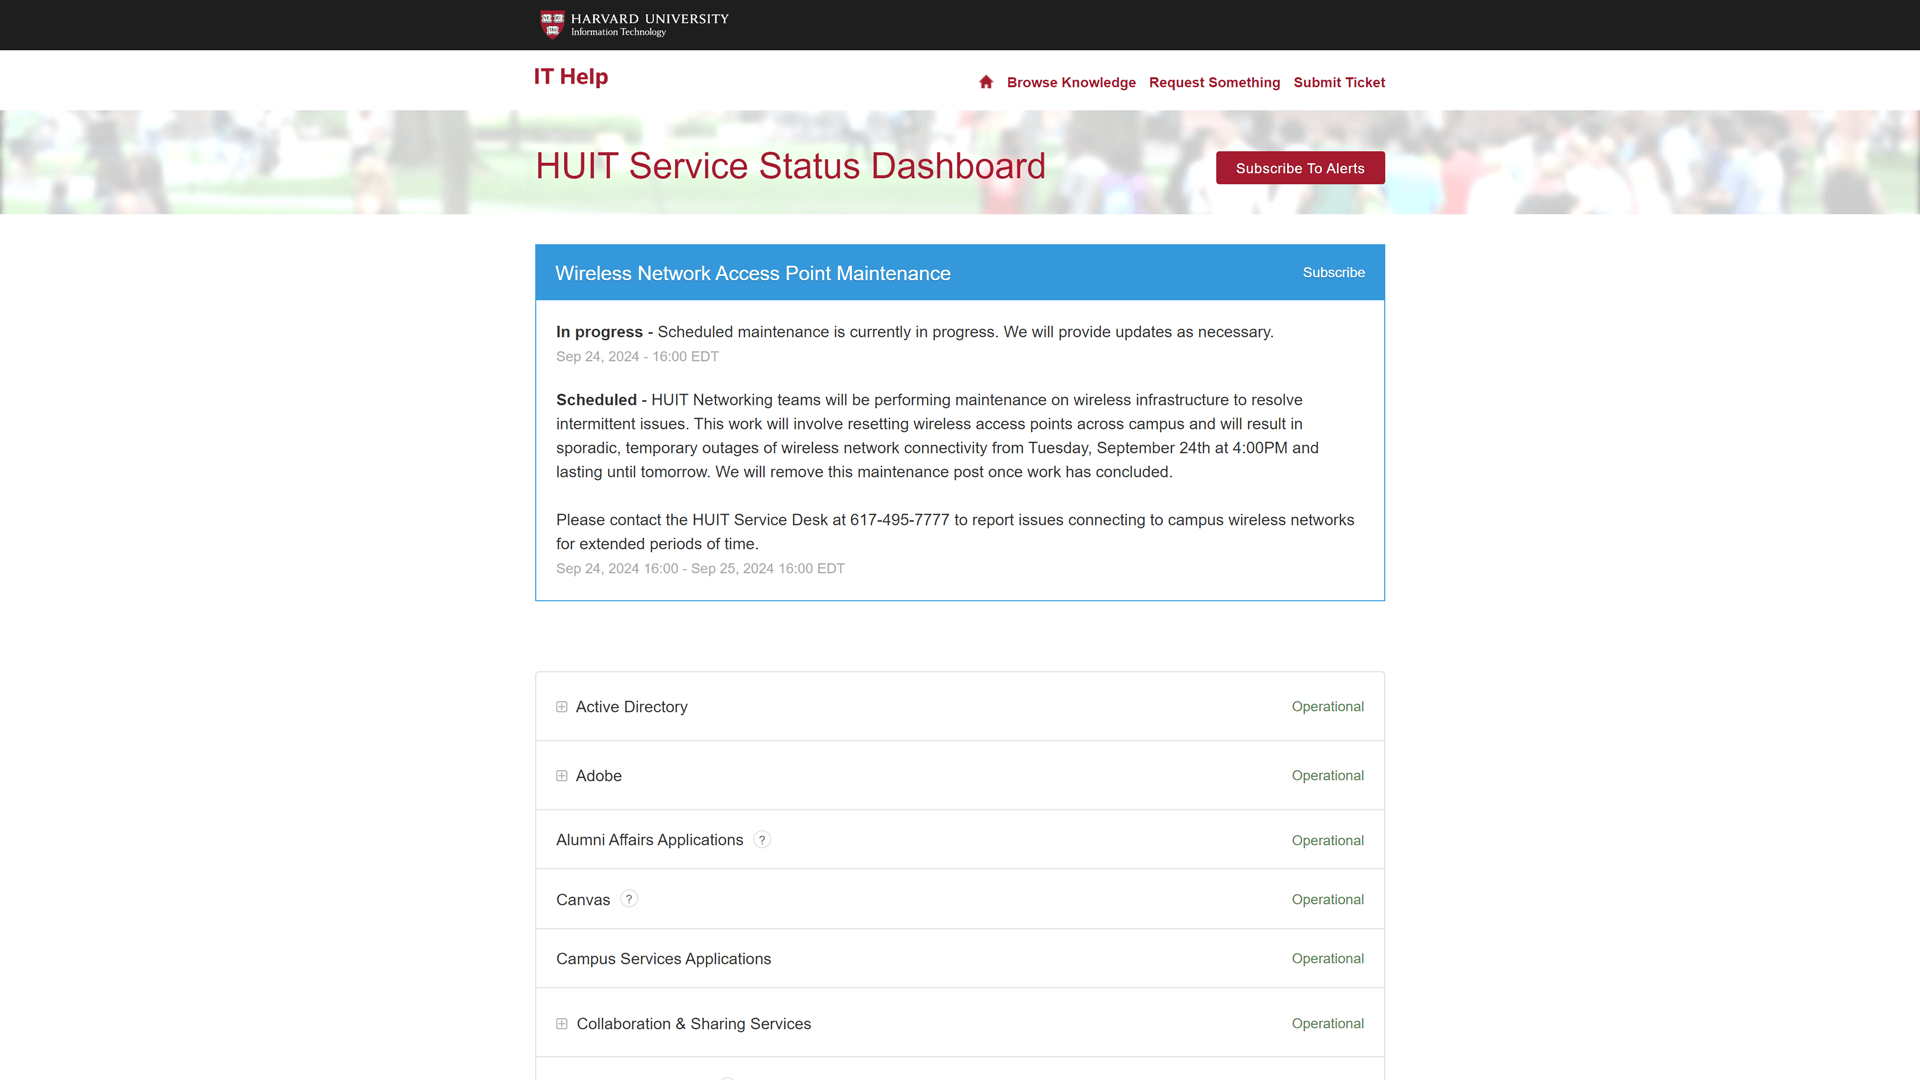
3. Harvard University
Status Page: https://status.huit.harvard.edu/
What They Do: They are a famous Ivy League University that has over 22,000 students. IT services for the entire Harvard community are covered on their status page. This includes LMS and CMS, as well as multiple networks and technical infrastructures.
What’s Great About Their Status Page? They have an Atlassian status page that displays a list of all their IT systems and their components. This ranges from network services and financial applications to LMS such as Duo and Canvas.
Their IT services and infrastructures are listed in alphabetical order for easy navigation. Icons are found next to some components but not all. It could benefit Harvard to have icons next to all components.
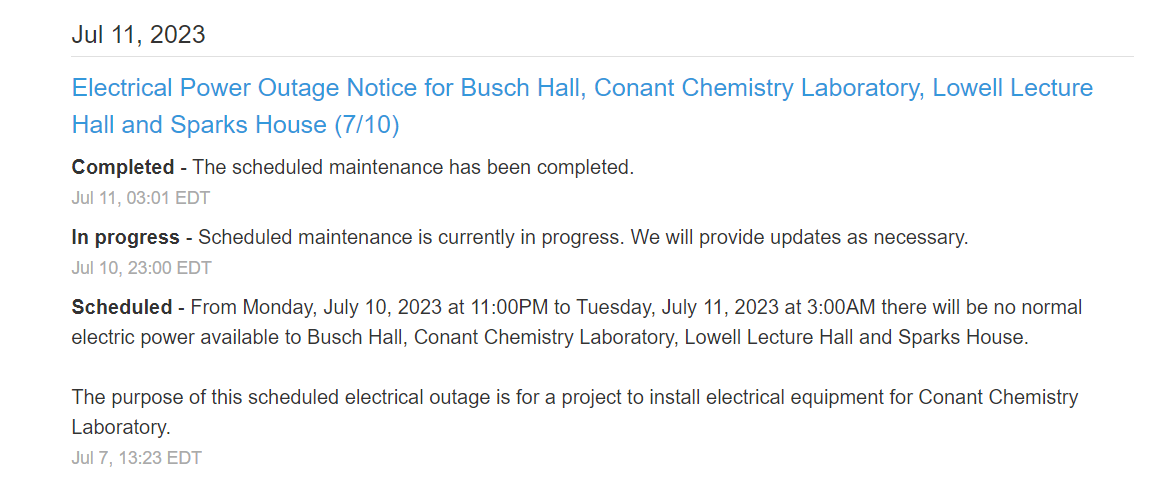
Sub-components can be found through a dropdown menu. Incident history is shown on the main page for the past 2 weeks. There is an option to view an extended incident history too. Incidents are clear and informative. A notable feature is that you can filter incidents by specific components.
Updates are organized clearly and have time marks next to them. Users can easily view an incident and see its timeline, as shown below.
Immediately, we can see their status page matches their University colors and identity. There is also a banner at the top of the page showing the Harvard campus.
They have green colors for operational status and blue for maintenance. They also have blue for “maintenance” and green for “operational”. However, Harvard doesn’t have a clear color scheme for incidents. In incident histories, there are some orange events, but it is not clarified if these are incidents or outages. Further clarification here would benefit Harvard’s transparency. Overall, their status page is eye-catching but also informative. However, a clear color scheme to categorize incidents would be beneficial. Bonus points are given for the page to be fully accessible for people with disabilities.
4. Massachusetts Institute of Technology (MIT)
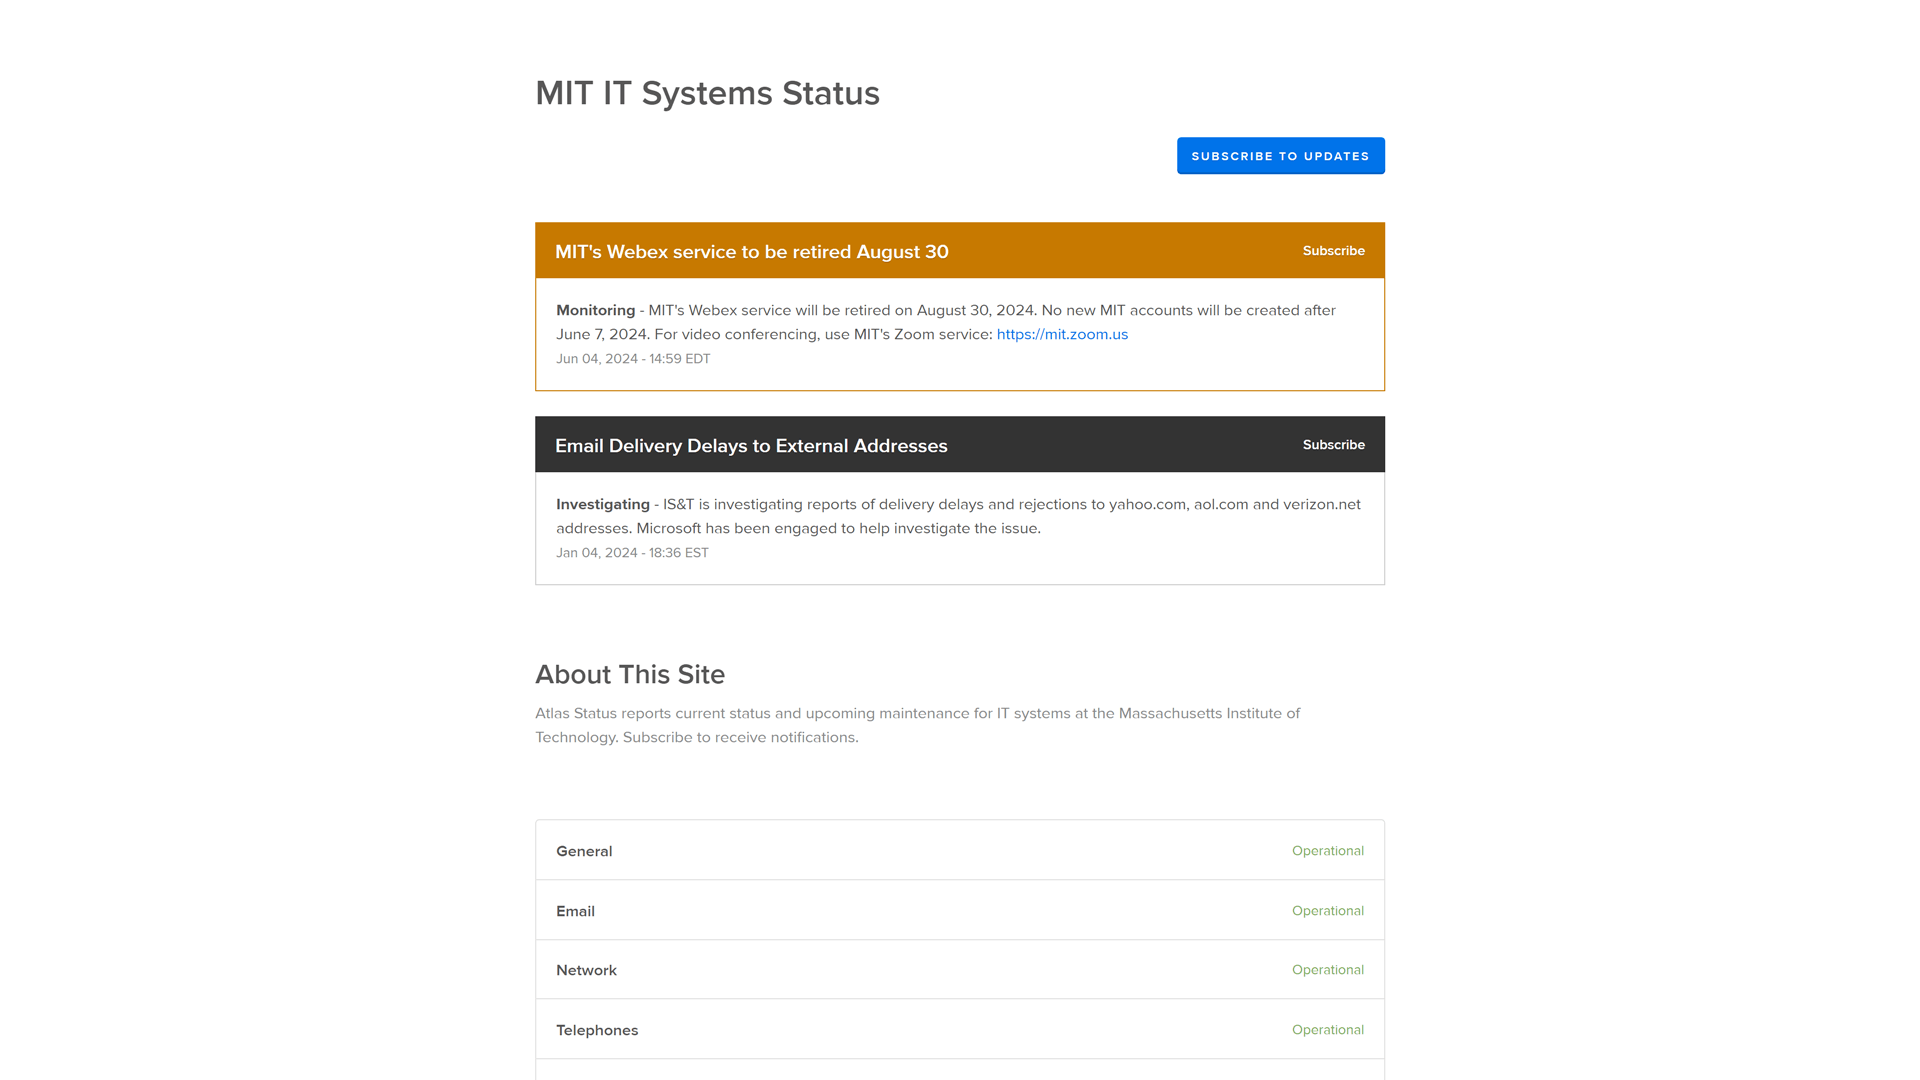
Status Page: https://atlas-status.mit.edu/
What They Do: Over 11,000 students study here and rely on various CMS, LMS, and communication services.
What’s Great About Their Status Page? They have an extensive incident history with clear and detailed reports for past incidents. Users can filter incidents by component/service. This is beneficial if they wish to find any trends or consistency with past incidents. In terms of functionality, the status page example for MIT is similar to that of Harvard. They use the Statuspage by Atlassian too.
MIT displays daily incidents from the past two weeks but includes an option to view a 3-month incident history. Incident reports are detailed and well-organized. They include time stamps for clarity too, as well as resolution details.
Scheduled maintenance is listed separately, but the color scheme for incidents is unclear. It would benefit MIT to clarify definitions for red, orange, yellow, and blue. Another improvement would be to specify services like email and network, which lack subcomponents. Visually, the page could be better too. The large MIT logo takes up too much space.
Overall, their status page is informative and detailed when it comes to incidents and maintenance. However, their logo needs to be reduced in size, and a clear color scheme is needed. The services that they offer and monitor could also be more specific.
SaaS and Software Status Page Examples
1. TrackSSL
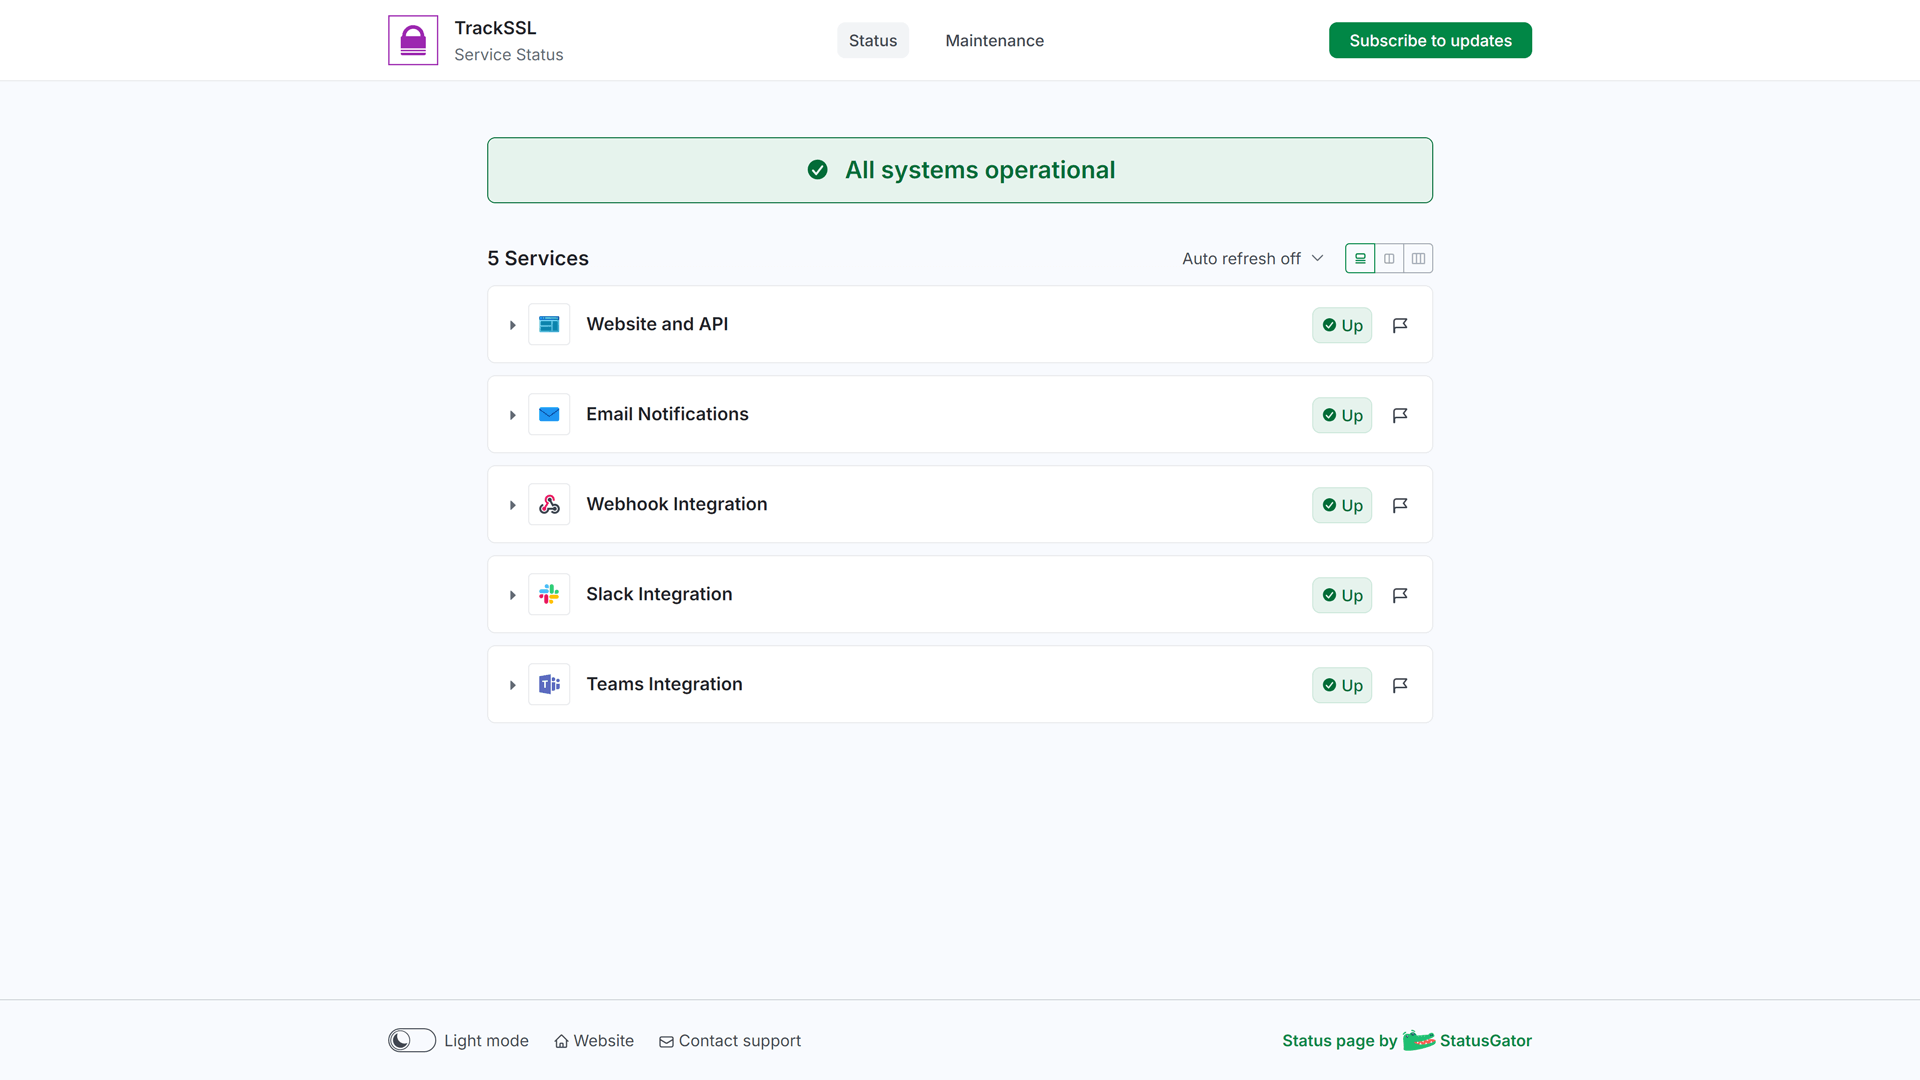
Status Page: https://status.trackssl.com/
What They Do: They are a SaaS company that offers monitoring tools and services related to SSL certificates and their renewals. Their monitoring helps users track their SSL and its expiry. They notify users in the event of changes that can help with transparency and protection from downtime.
What’s Great About Their Status Page? They have an eye-catching status page with multiple features and easy navigation. By using a hosted status page with StatusGator, they include features rarely seen with other providers.
One of these features is a dark mode. They also have a flag icon next to systems for users to raise any issues. They have a subscribe button at the top of their page as well as their logo. With this, combined with StatusGator’s color scheme, they have an eye-catching status page.
TrackSSL also takes advantage of early warning signals. It’s an advanced algorithm that analyzes thousands of data points every minute to identify potential service disruptions. It provides proactive alerts about issues with your critical dependencies, helping you stay ahead of outages and minimize downtime.
Another feature is a handy button that can switch between grid and compact view. In this case, there are only two services (Website and Dashboard). This is a useful feature to include on a status page. Since they use StatusGator, any future services they wish to monitor can be shown in the same place.

On top of this, there is a drop-down menu to see the past 30 days of incident history. However, TrackSSL is amongst the few status pages to display a clear color scheme when it comes to incident history.
One room for improvement would be to display longer periods of historical uptime to boost transparency.
2. Quickbase
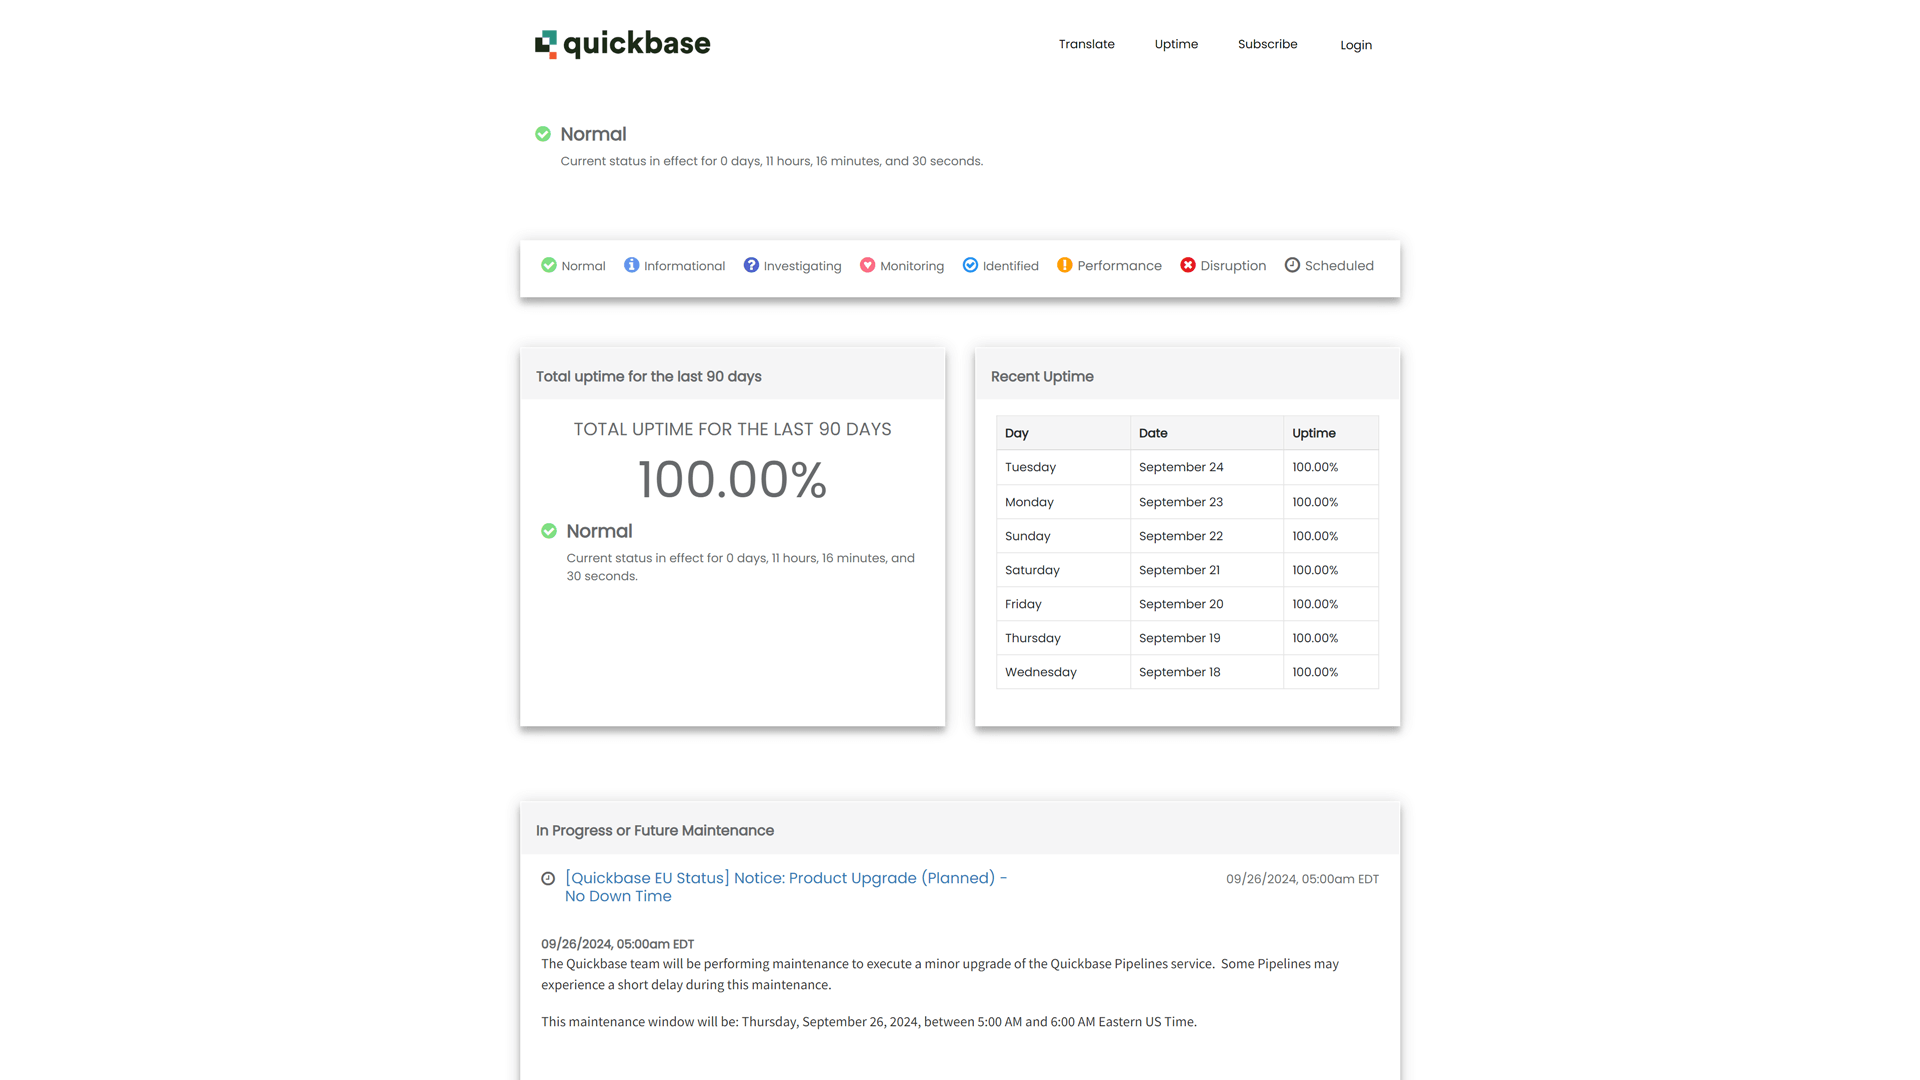
Status Page: https://quickbasestatus.status.page
What They Do: They are a platform used by teams and collaborators to create applications for their business needs. They have no-code development strategies and a dashboard that accumulates all elements of their projects into one place.
What’s Great About Their Status Page? It offers a clear and informative color key, with a high level of detail for previous incidents.
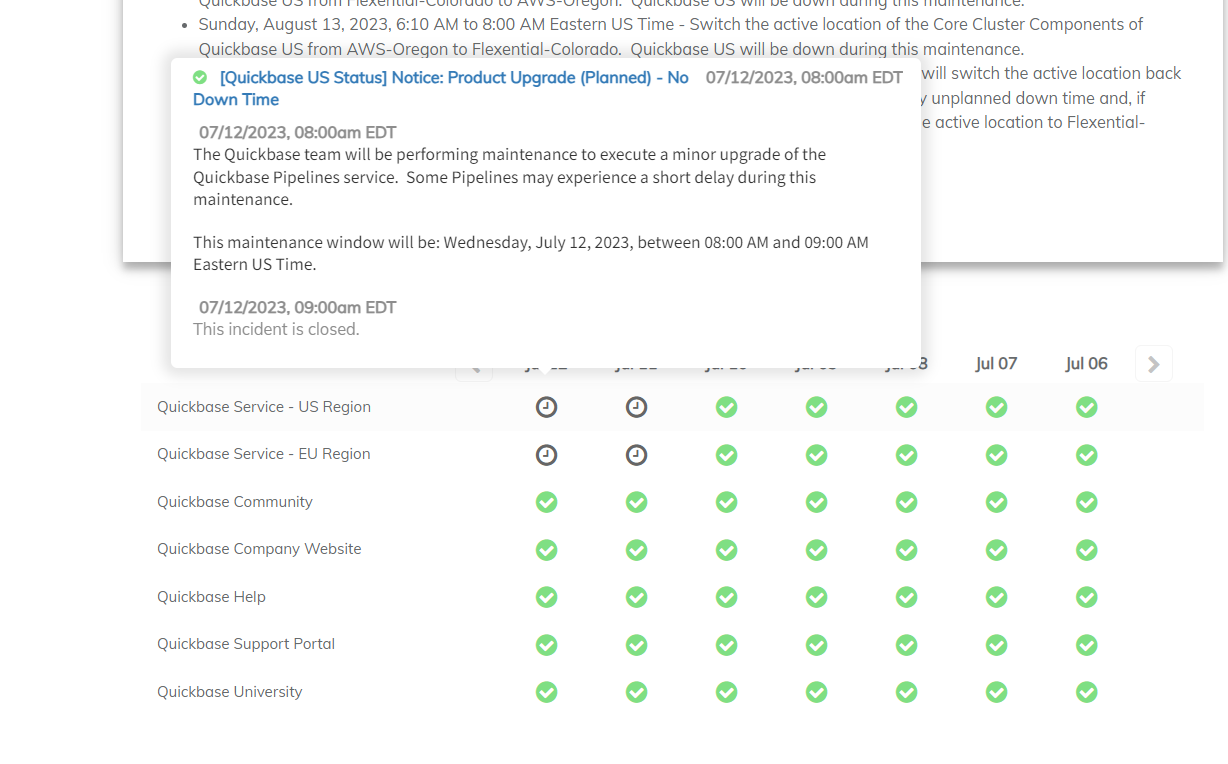
Their page features a color key for incidents. There is also a large box showing the 90-day uptime percentage. Maintenance is separated from past incidents for clarity too. A 7-day uptime history includes detailed popups for incidents or maintenance. Some other features include a translate button, a subscribe option, and detailed incident descriptions.
However, the recent events section is overly long. This makes it difficult to find specific incidents. The detailed and well-structured events should be organized better.
Overall, their status page has a very clear color key and attributes that help a user navigate the page. However, the list of recent events could be better organized. It could be done using a filter or an option to show/hide the full list.
3. Datadog
Status Page: https://status.datadoghq.com/
What They Do: They are a monitoring-as-a-service company that offers monitoring tools, primarily for analytical and metric purposes. Datadog collects information from a variety of sources and unifies it into one place. Users can then customize their dashboards to facilitate the analysis.
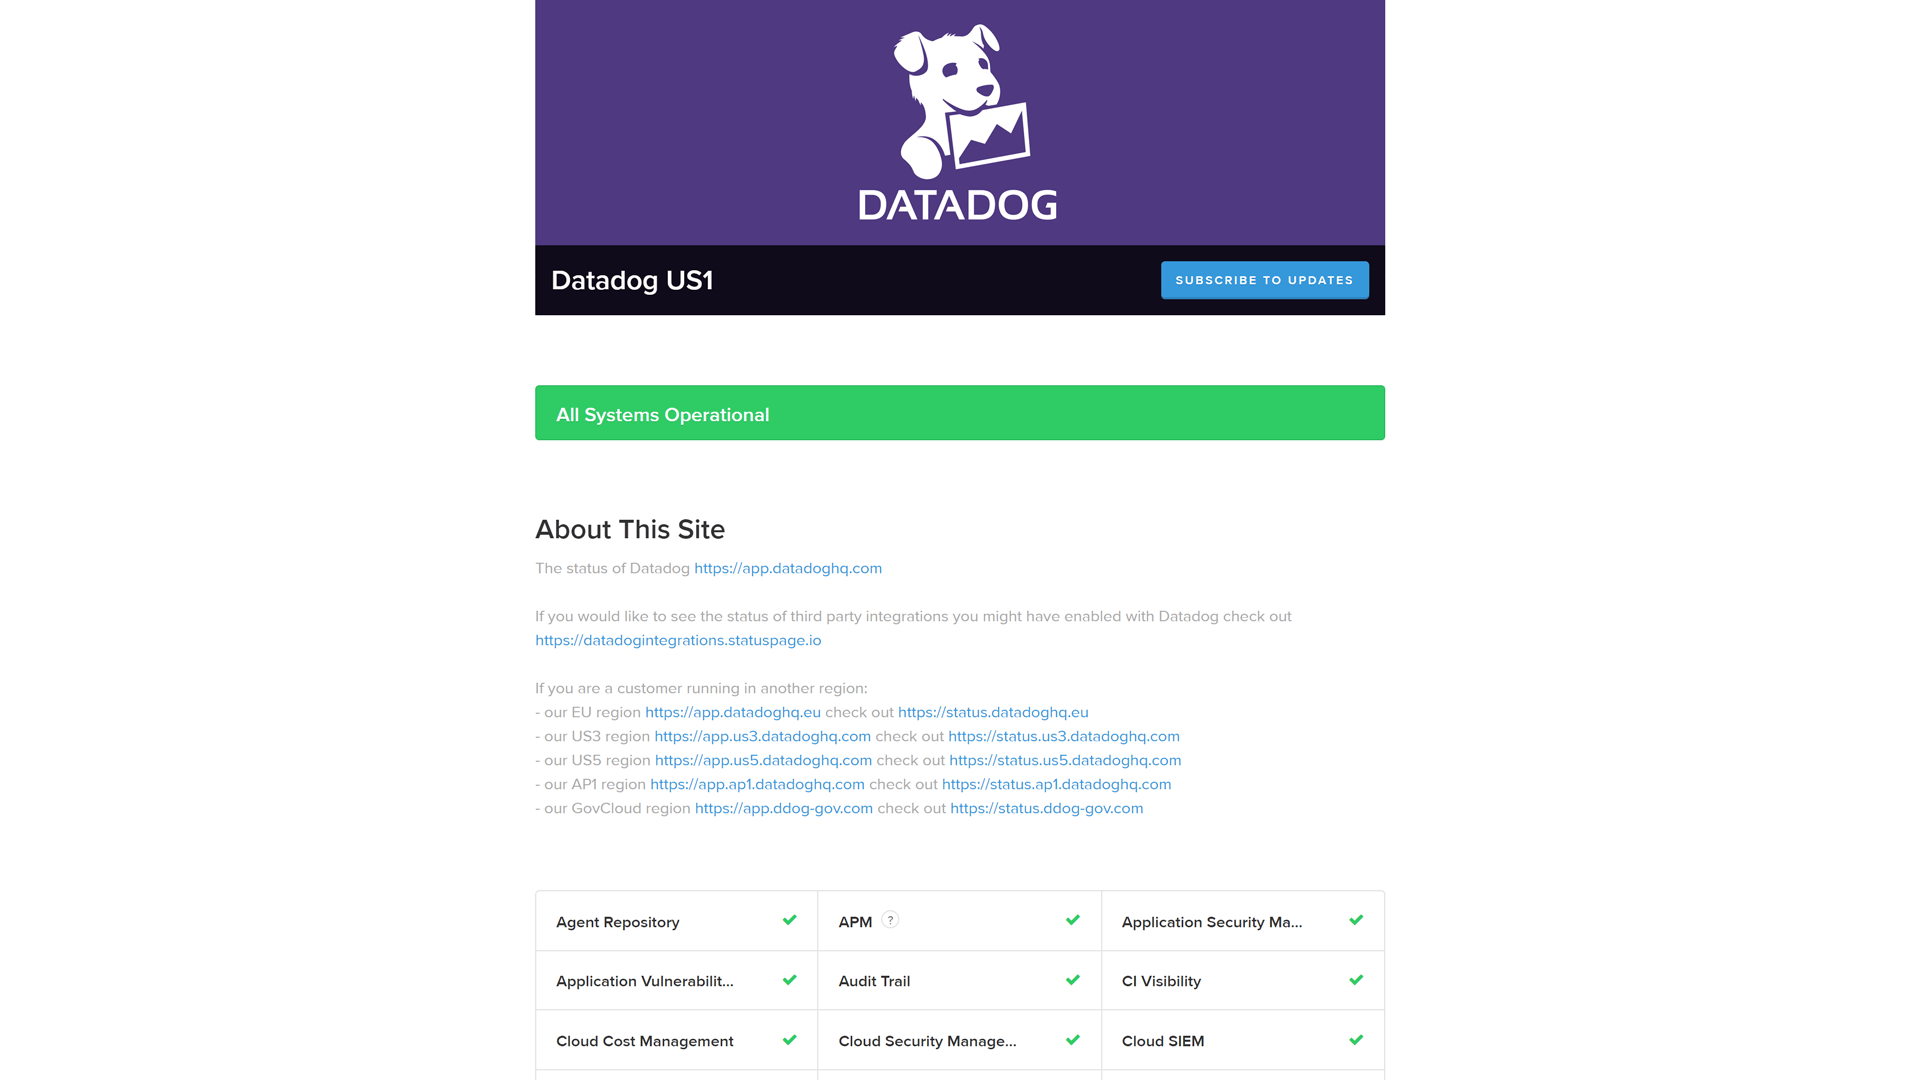
What’s Great About Their Status Page? Datadog’s status page focuses on global communication with links to region-specific pages.
They offer third-party integration statuses too, enhancing transparency. A color key categorizes events for users, visualizing maintenance, downtime, and issues. The page shows a 2-week incident history with an option for more extended history and includes a subscribe button.
Visually, the page is clear and easy to navigate. It aligns well with Datadog’s identity and color scheme too. However, whilst components and statuses are listed, they lack explanatory icons. This would be beneficial for users. The large logo, similar to MIT’s, takes up too much space too. This requires unnecessary scrolling, so a smaller logo would improve visual effectiveness.
Additionally, there are no other images or banners on the page, meaning they have kept their status page minimal.
Overall, their status page accounts for a wide user base and is a more transparent status page example. Their status updates are informative and coded. However, They could have a smaller banner, as it currently takes up almost half the screen when you first visit the page.
4. Amazon Web Services
Status Page: https://health.aws.amazon.com/health/status
What They Do: They are a cloud computing platform and cloud service provider. They have over 200 different services to offer and cover 31 regions with 99 availability zones..
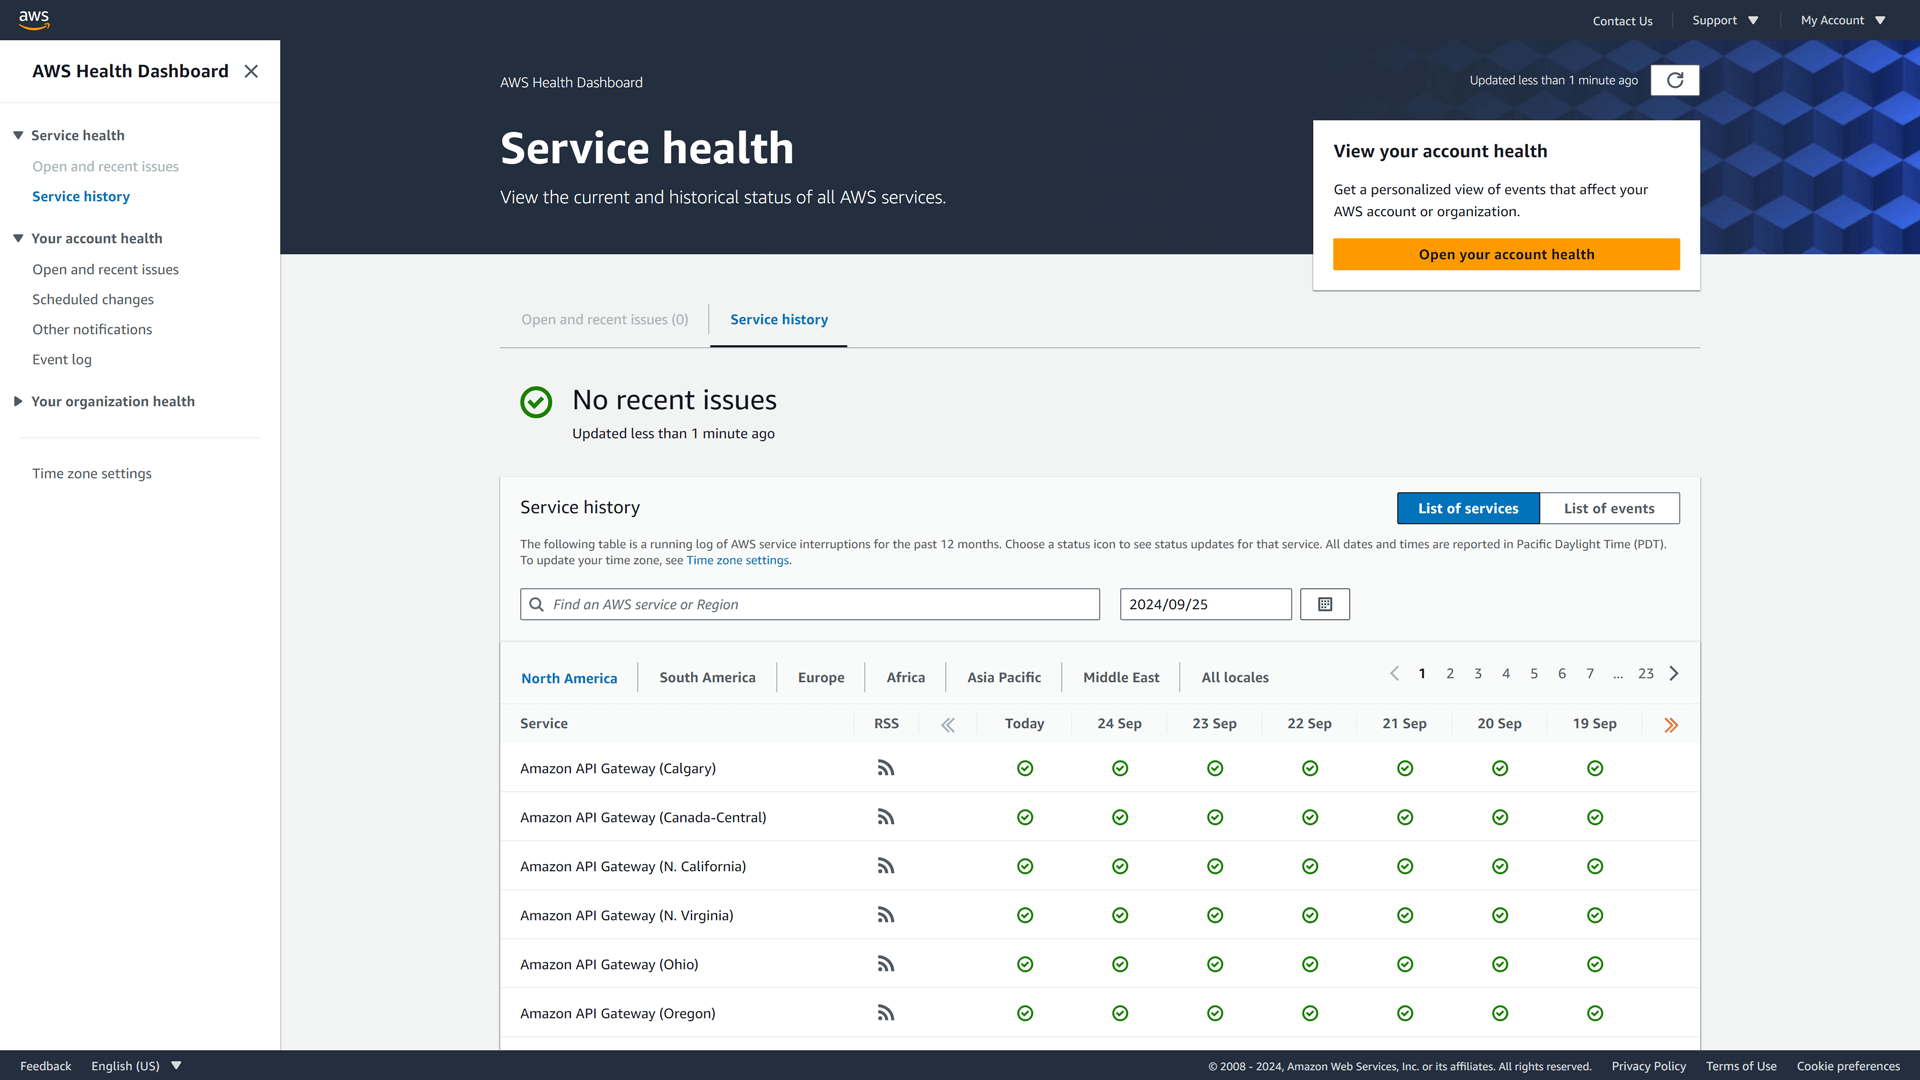
What’s Great About Their Status Page? AWS has a “service health” page listing all regions and services alphabetically. This makes searching a lot easier, and users can easily find operational status.
A side dashboard provides quick access to Account Health and overall AWS Health too. Account Health offers a personalized overview of services related to the user’s account. This page allows users to switch between ongoing issues and service history. There is an option to view 12 months of history by entering a specific date.
AWS’ status page allows filtering by region or specific services. Users can view post-event summaries, which whilst detailed, could be better organized. Visually, AWS’s status page is a good example of minimalism. It uses a basic color scheme with a dark blue banner that aligns with their identity. That said, it doesn’t dominate the page.
Overall, despite not being called a status page, AWS’ service health page contains a breakdown of the current status of its services. With so many on offer, it is key that AWS provides the option to filter results. They have successfully done so with the option to search, specify dates, and separate statuses by region.
5. DigitalOcean
Status Page: https://status.digitalocean.com/
What They Do: DigitalOcean is a cloud computing platform offering a range of services for software developers. They have a primary focus on Infrastructure as a Service (IaaS) for application and web hosting. They provide five different “droplet” plans.
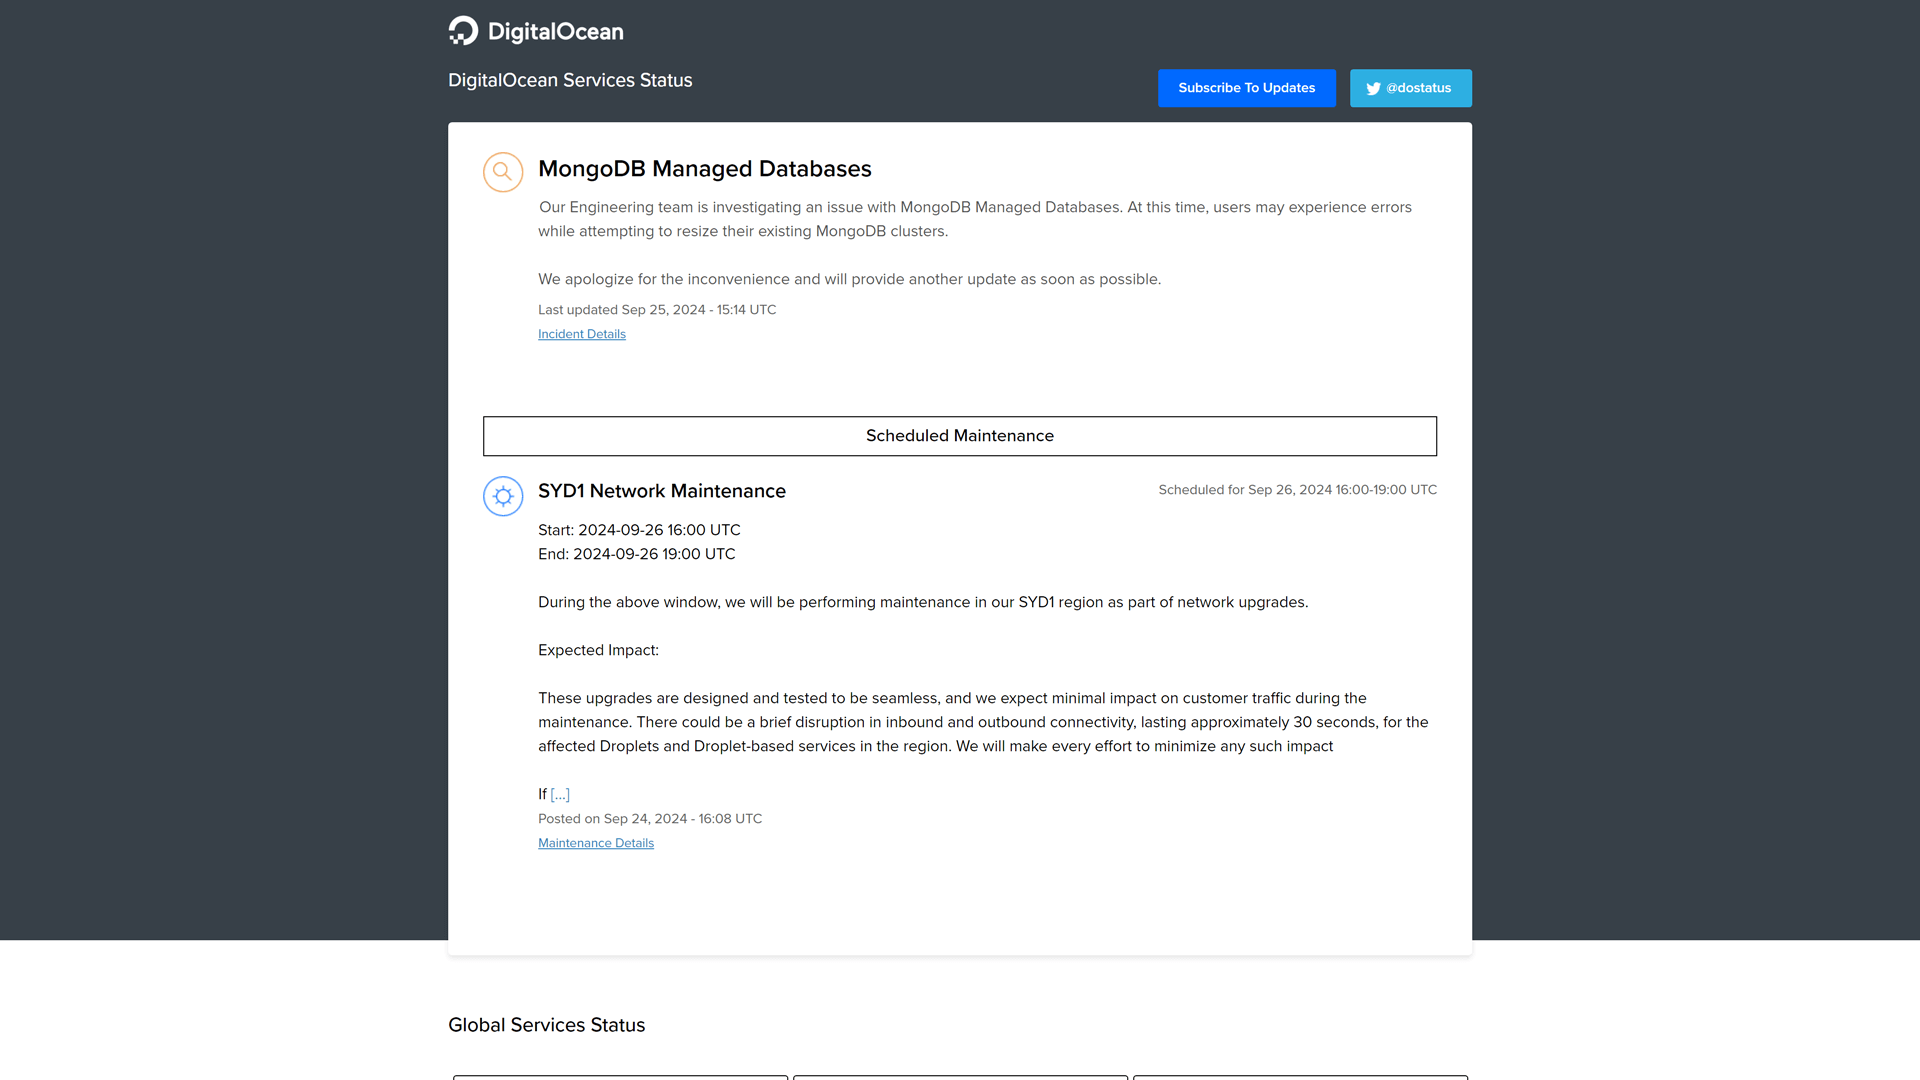
What’s Great About Their Status Page? Their status page is clear, dividing services into regional and global categories. They have a dropdown menu displaying the operational status of components across regions. An Atlassian-powered page allows users to view 3 months of incident history. This has clear color coding (Critical, Major, Minor, Maintenance, Retroactive) that enhances transparency. Users can filter incidents by component and access detailed reports with time stamps.
Despite lacking a tailored color scheme aligned with DigitalOcean’s identity, the page remains clear and user-friendly. They prioritize functionality over aesthetics
Overall, their status page has an effective use of a color code to separate incidents. Features such as a filter button and highly detailed status updates all help with transparency. The only room for improvement could be the enhancement of its visual aspects. This could be done with an image or banner.
6. Docker
Status Page: https://www.dockerstatus.com/
What They Do: They offer various platform-as-a-service (PaaS) products that package software into containers to be used quickly. Users can then use these containers to build, run, and develop applications. Developers can then share and collaborate on application projects with all their tools and software in one place.
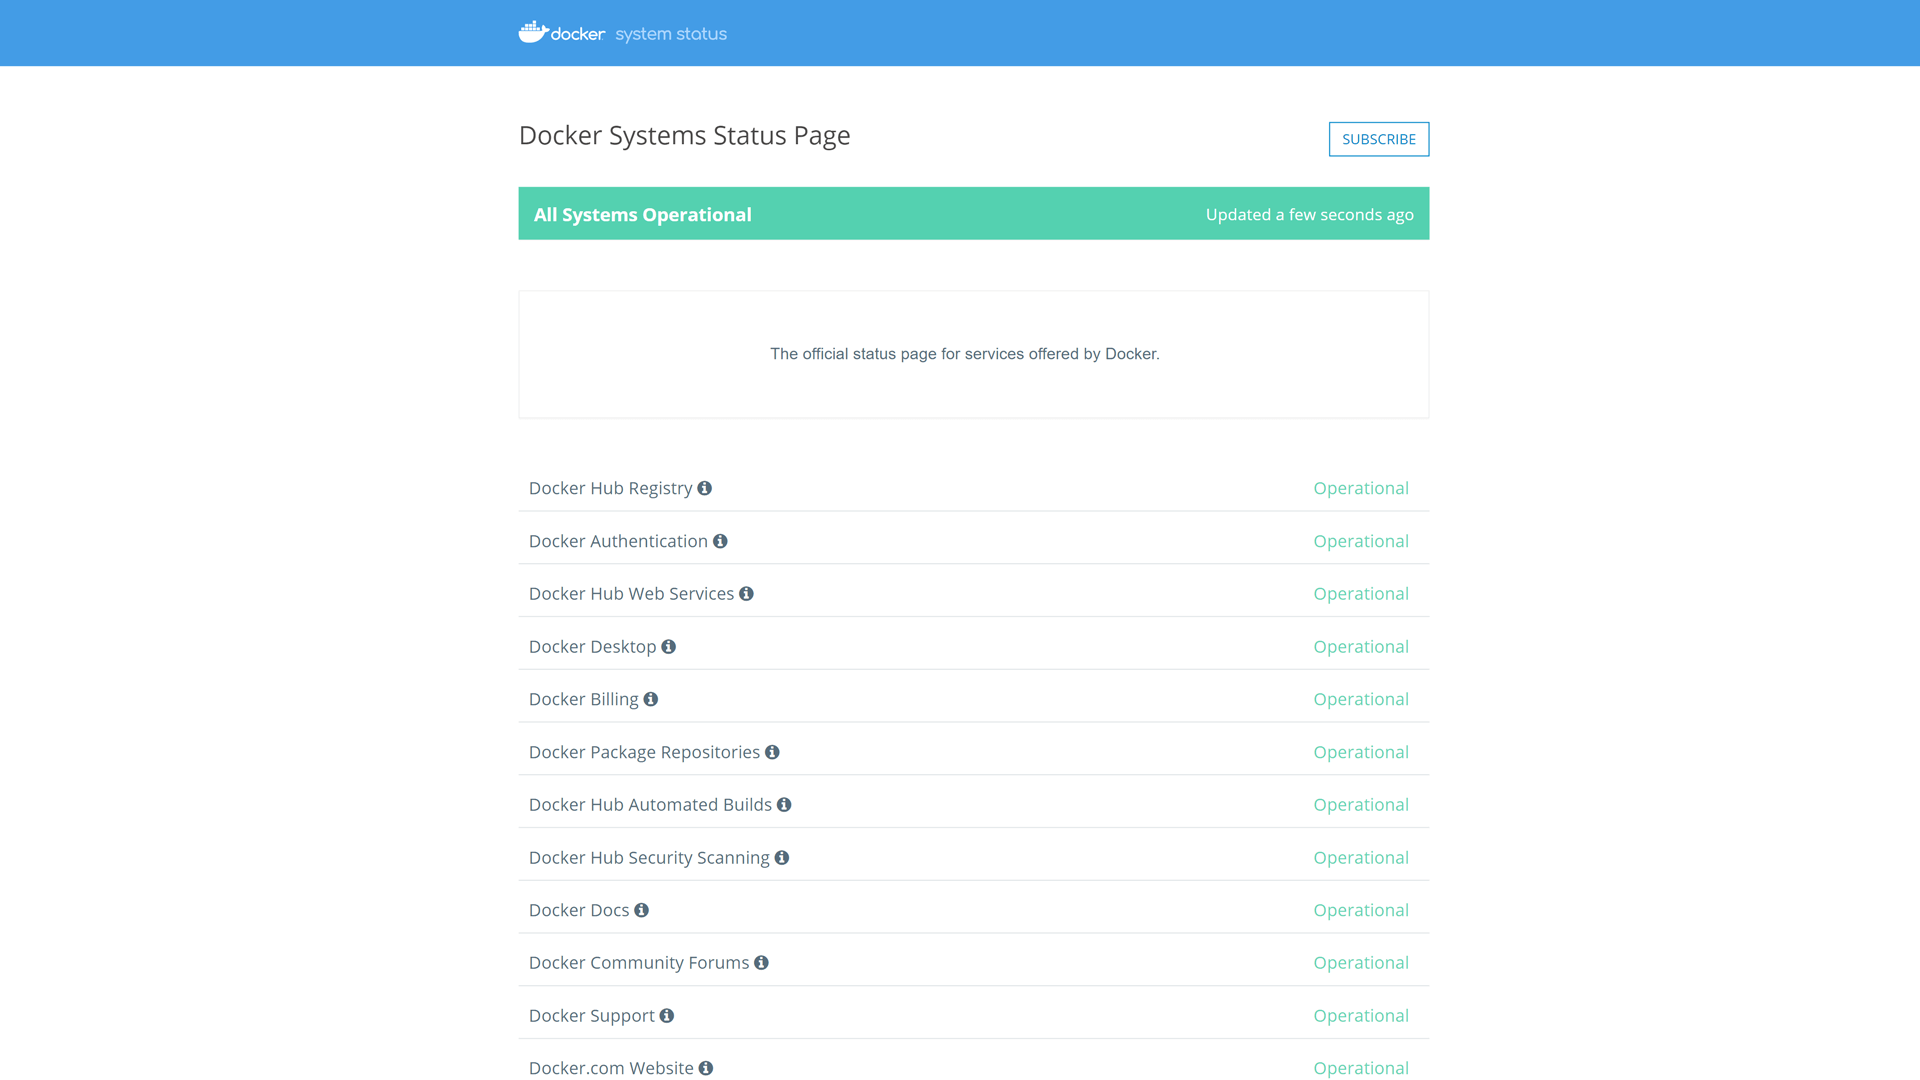
What’s Great About Their Status Page? Docker offers a metric section with a timeline of the uptime and response times for certain components/services. It is a unique feature that is rarely seen on status pages. Users can also view metrics for a month, a week, or the current date.
These metrics are just below the statuses of their components and services. Each service or component has an icon that provides a breakdown of what is being monitored. This is a useful feature for less tech-savvy users. Incident history is also highly detailed and can be filtered so the user can easily search for more specific events. There is no clear color code, which would be beneficial for Docker.
Visually, Docker keeps its status page simple and clear. They have a dark blue banner at the top of the page with their logo. This hints at the customization of their status page.
Overall, their status page is easy to navigate and includes the beneficial metrics feature, but it could be more transparent by having a clear color code for users.
7. Heroku
Status Page: https://status.heroku.com/
What They Do: Similar to Docker, Heroku is a cloud-based PaaS for developers to create, develop, and scale applications. They support multiple different programming languages to support container-based app development.
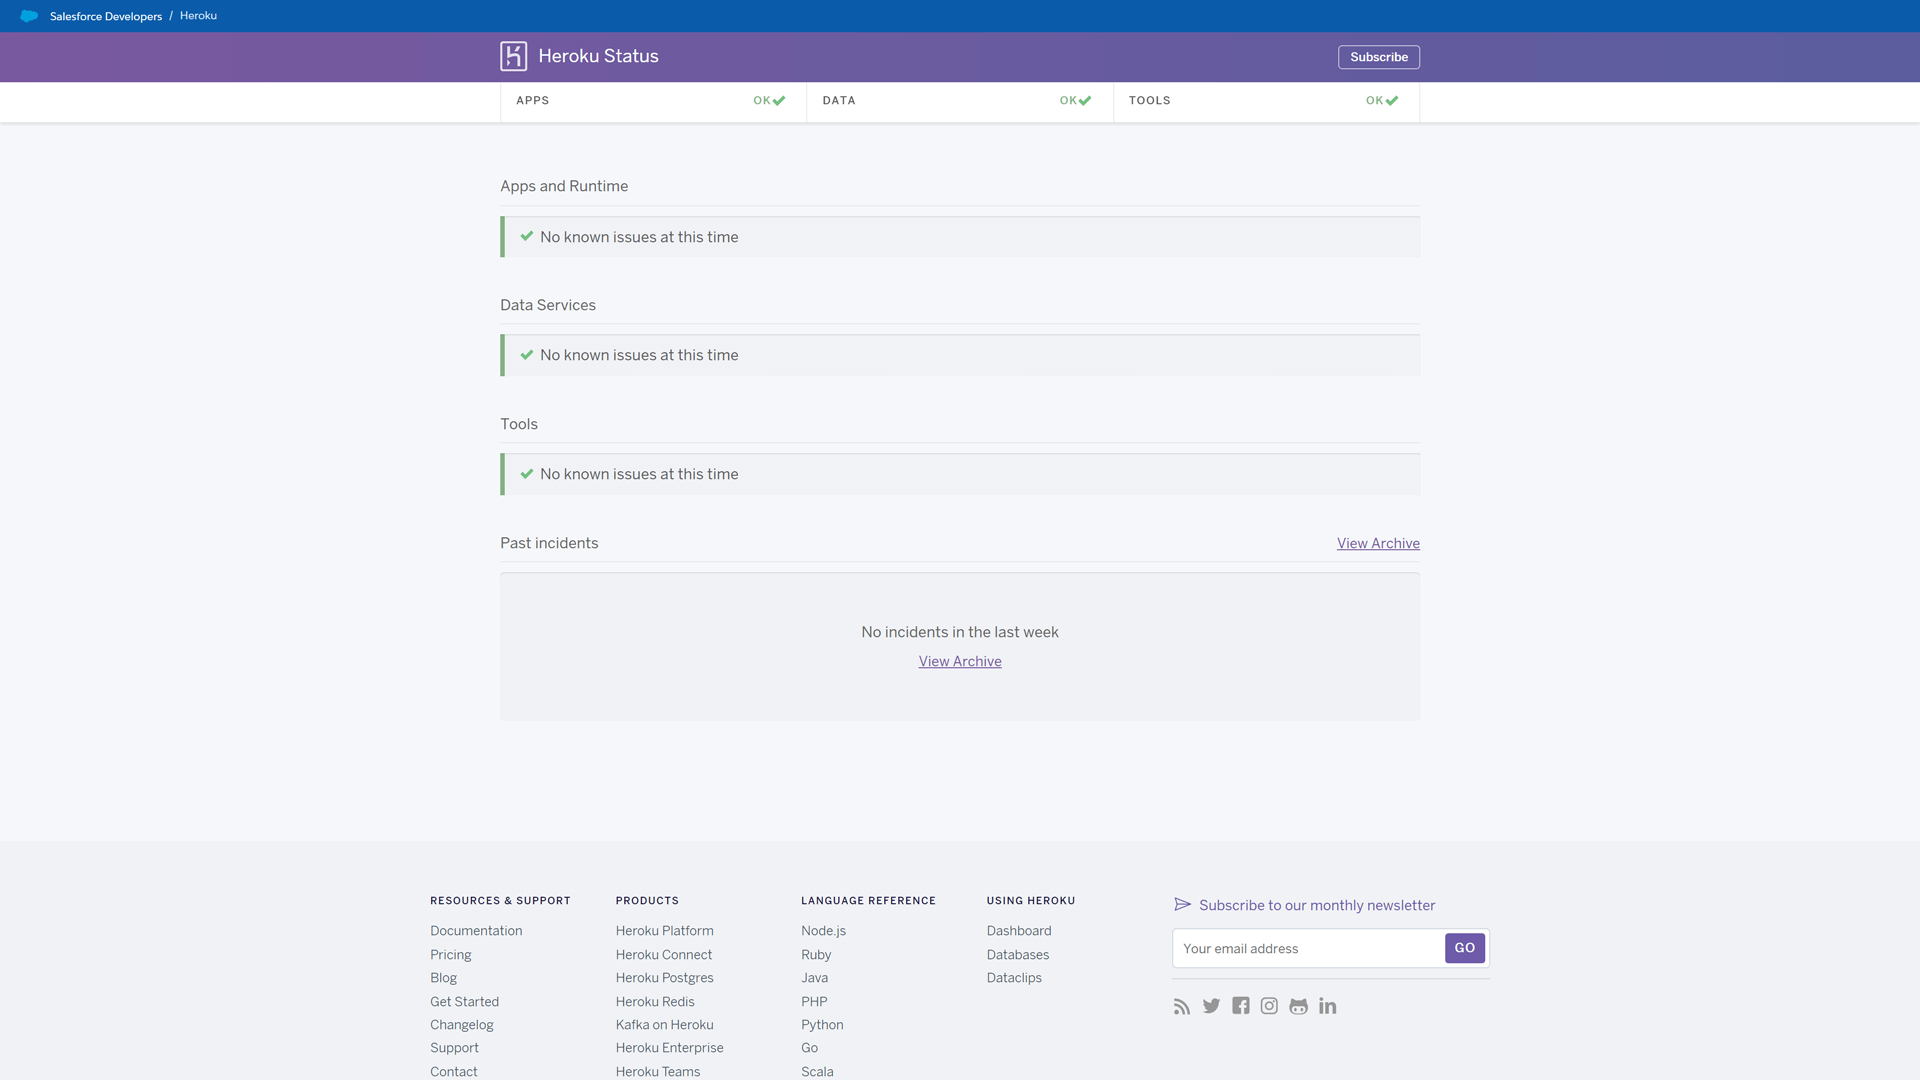
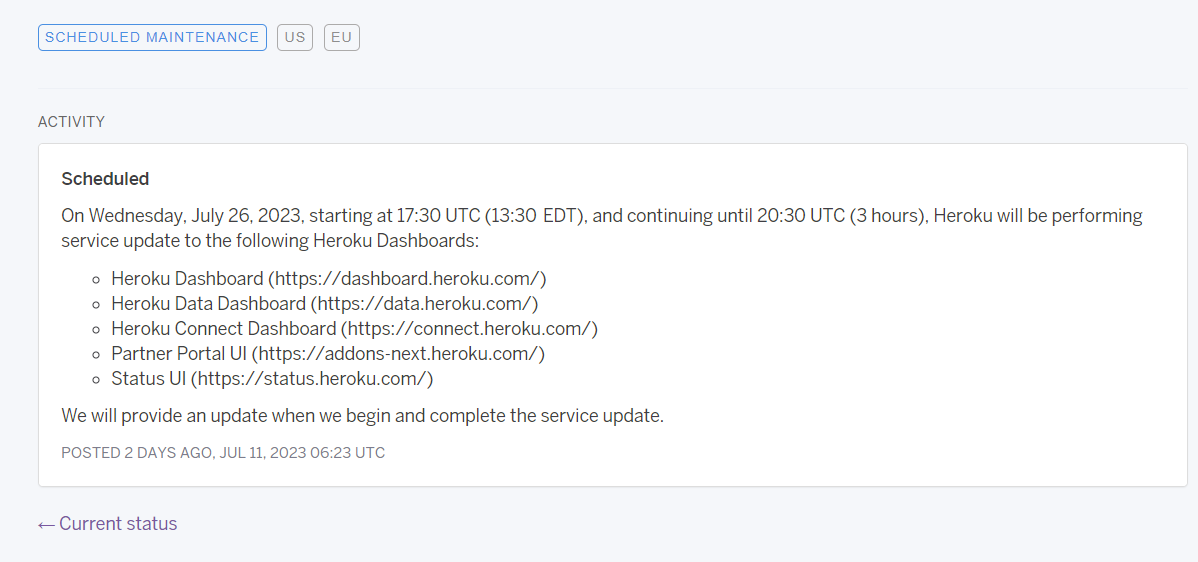
What’s Great About Their Status Page? Heroku’s status page is simple. It displays incidents and downtime clearly so users can quickly identify issues. Events are prominently featured, with updates providing detailed information. Recent incidents are listed in detail so users can access an extensive list of past events. However, a filter or search bar would improve navigation. A color code for incidents would also be beneficial.
At the top of the page, a blue and purple banner with Heroku’s logo can be seen. There is an option to subscribe to updates too. Users can click icons to view the status of Apps, Data, and Tools. However, this feature only scrolls slightly down the page, offering limited utility.
Overall, Heroku is transparent. They have provided an extensive incident history with all the relevant information. However, functionality can be improved by adding a filter, a search button, or displaying more categories of systems and components being monitored.
8. Cloudflare
Status Page: https://www.cloudflarestatus.com/
What They Do: Cloudflare provides website optimization, security, and performance services. They are primarily known as a content delivery network platform and one of the most popular CDN providers.
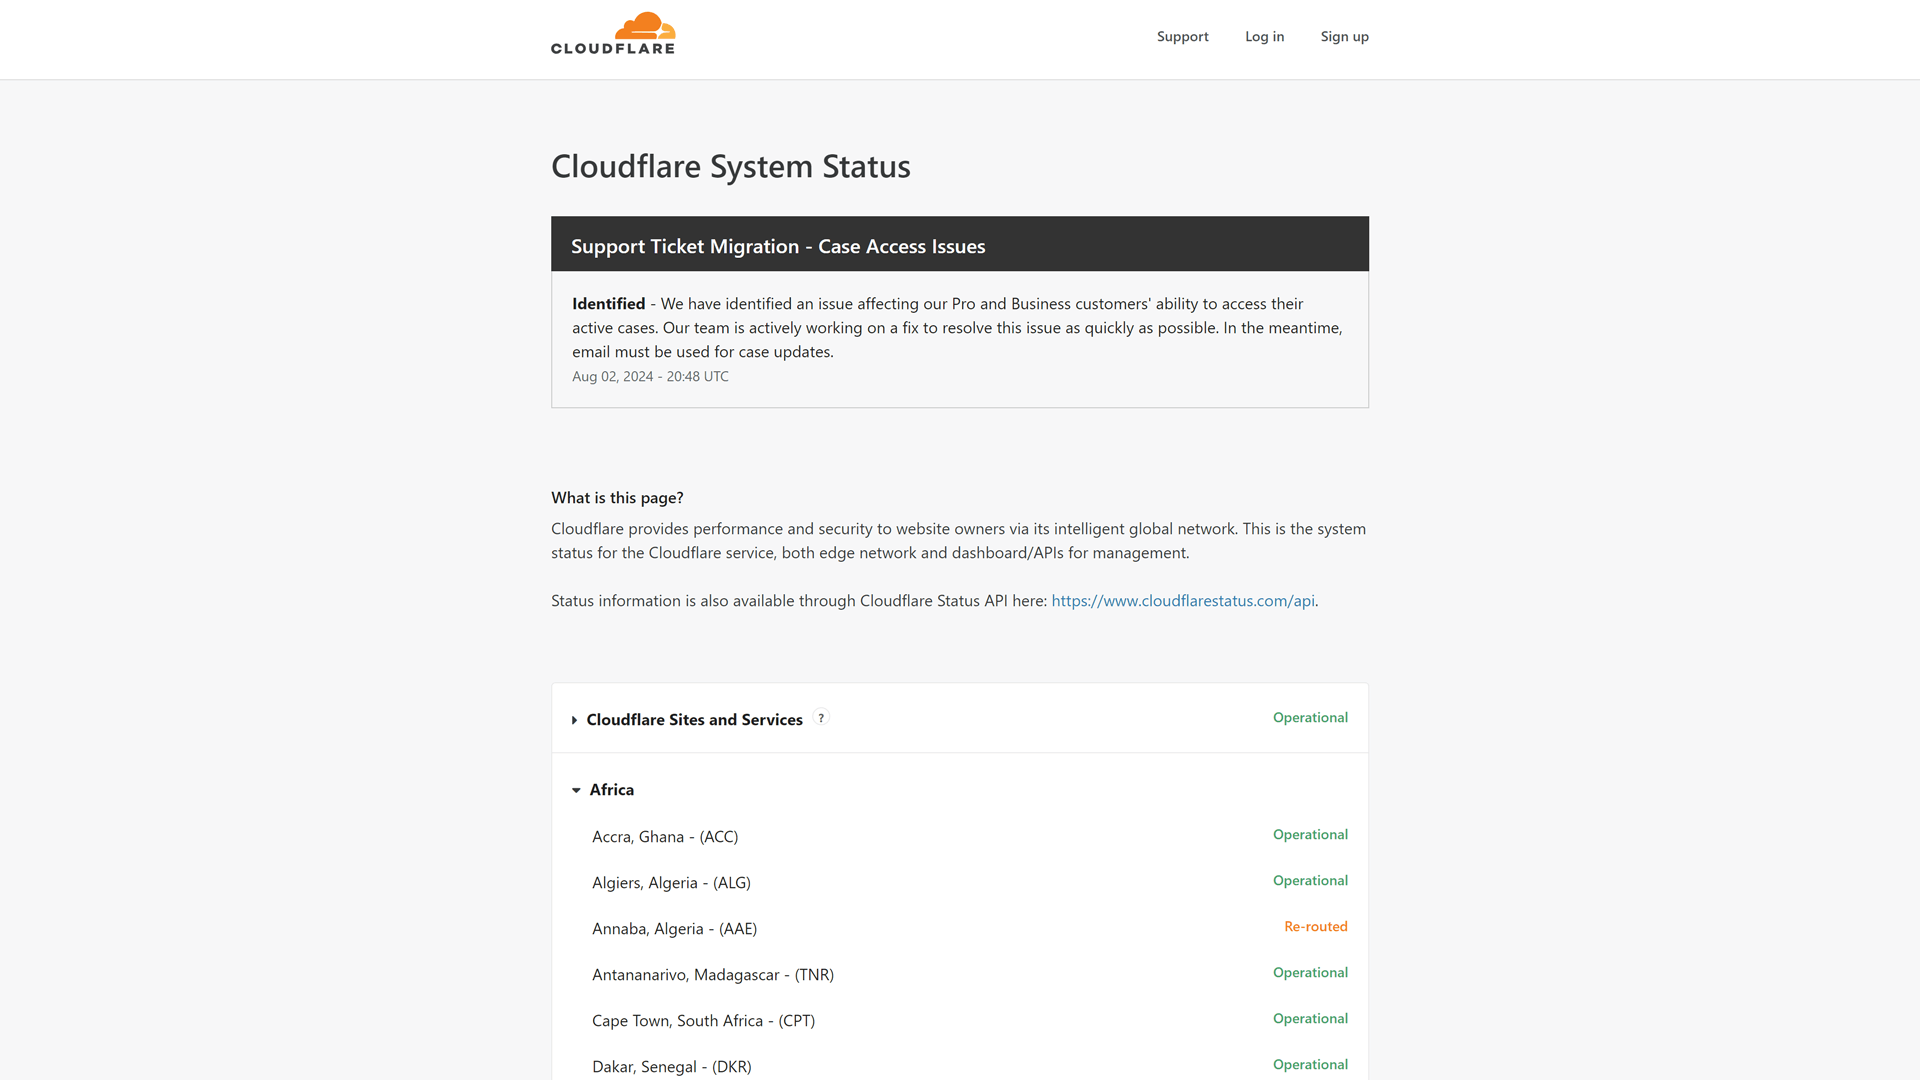
What’s Great About Their Status Page? Their status page contains statuses of services and geographical regions. For example, there are separate dropdown menus for different continents, as well as the Middle East and Latin America/Caribbean.
The categorization of these regions by continent/region makes navigation for users easier. Users can simply scroll to their region to see its current status. Under these menus are sections for scheduled maintenance as well as past incidents. These sections contain sufficient detail and make it easy for users to understand the event that has occurred or is planned.
There is no subscribe option, but there is a button for support. Whilst the page is informative, it can be difficult to navigate. The list of past incidents is very content-heavy. Since the button to look at extensive incident history is at the bottom, it can be inconvenient for users to navigate to.

Overall, their page is simple and informative, and the categorization of statuses by region is a plus. However, there is a lot of information regarding past incidents on the first page. This means scrolling takes a while. Since there is an option to view incident history anyway, it might make more sense for Cloudflare to only show past incidents for a smaller period.
9. Segment
Status Page: https://status.segment.com/
What They Do: Segment is a data management platform that collects, cleans, and ‘activates’ their customer’s data. Over 25,000 businesses use Segment for data management purposes. With Segment, businesses can gain analytical insight into their customers.
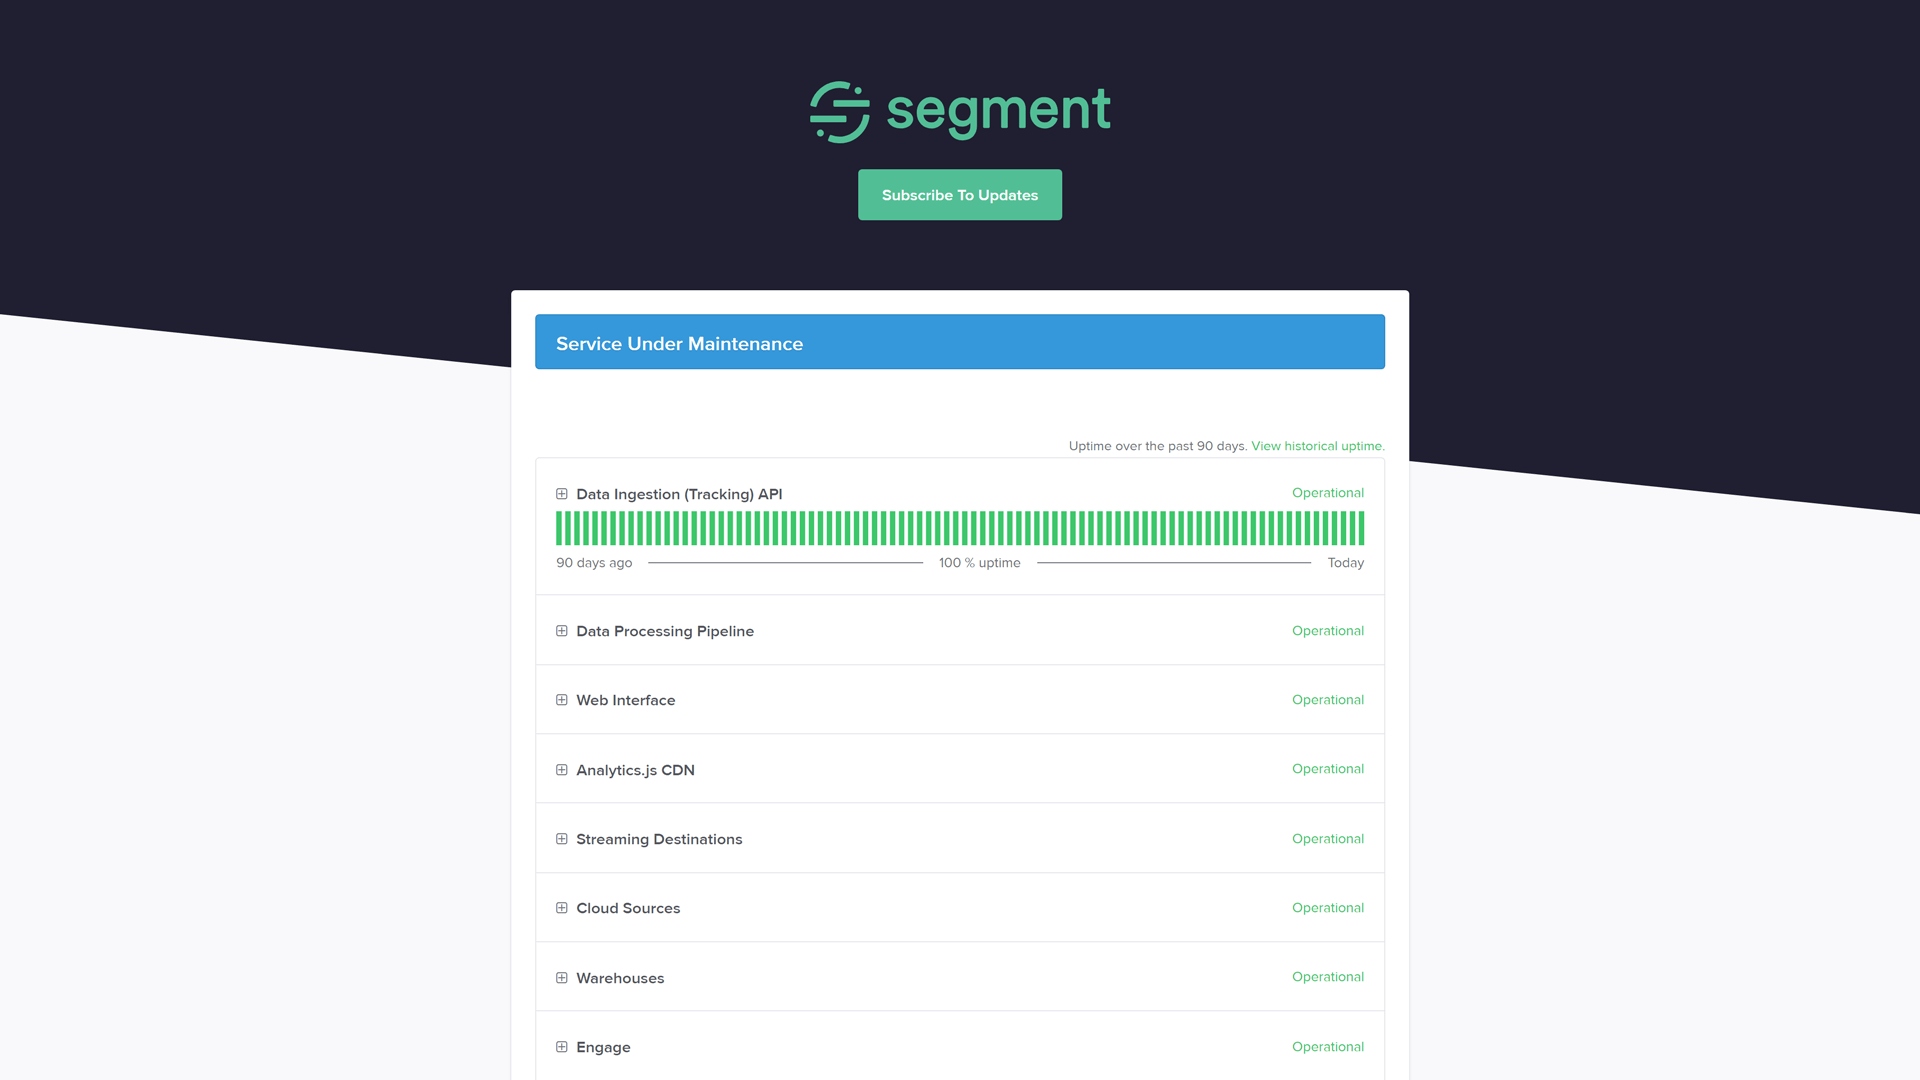
What’s Great About Their Status Page? Not only does it cover status updates and metrics, but it’s also well-organized and easy to navigate.
Firstly, their Atlassian status page shows the current status of their services. There is a 90-day uptime history. You can also click an icon that drops the menu down to show the status of the components. Users can see the metrics section in these drop downs, similar to the Docker’s status page example. You can view metrics for certain attributes, such as API latency and API response time.
A 2-week past incident history is available under the metrics section. There is also an option to view an extended incident history. Users can use the filter setting in incident history to make navigation to specific incidents easier. Additionally, you can view uptime history in grid view as well as incident history.
This factor, alongside metrics, indicates transparency on Segment’s behalf. You can also subscribe to updates and notifications. Incidents and updates are detailed and informative but would benefit from a color code to categorize events.
10. Twilio
Status Page: https://status.twilio.com/
What They Do: Twilio is a customer engagement platform that allows users to create and personalize their communication infrastructures. With Twilio, you can customize your communication preferences to your customer base.
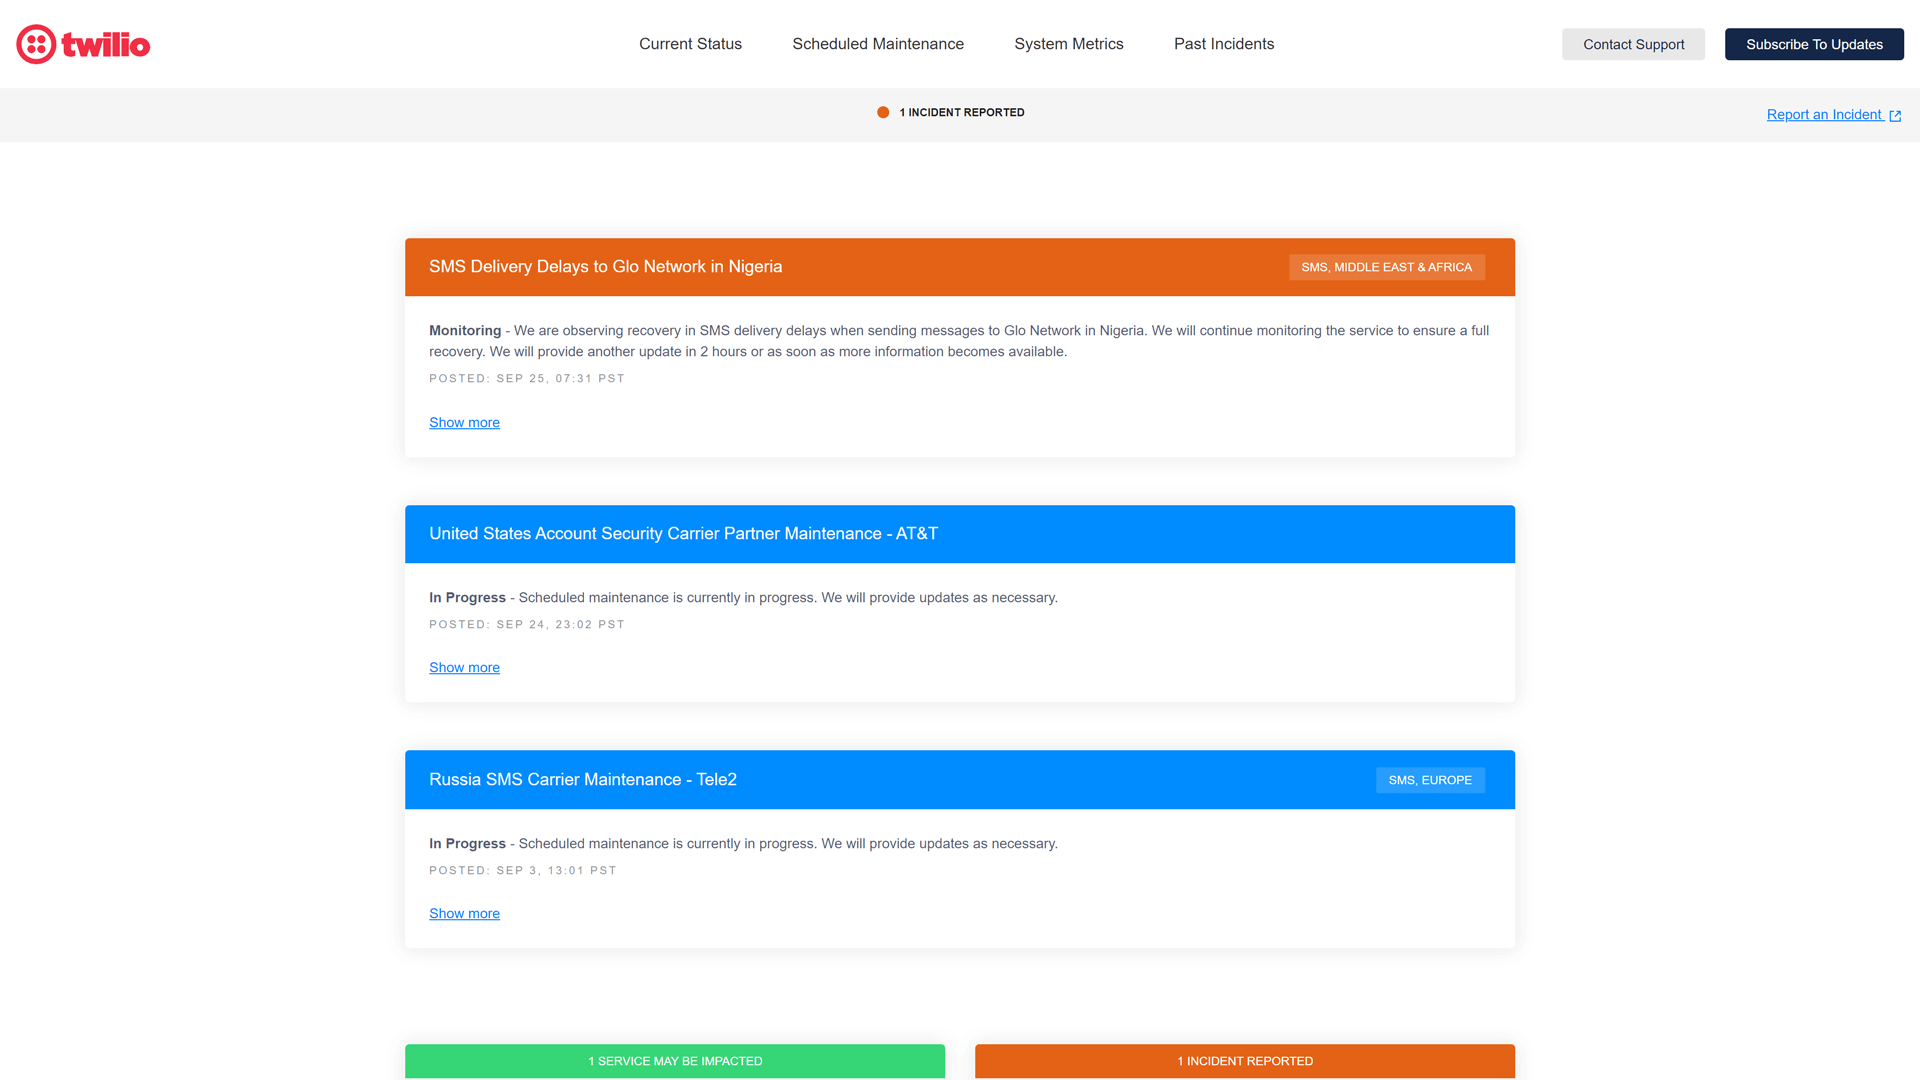
What’s Great About Their Status Page? They provide lots of information on their status page. However, navigation is made easy.
They have buttons at the top that automatically navigate you to the appropriate page section. For example, they have a maintenance button, which will automatically guide you down the page to the maintenance section.
On top of this, their Atlassian status page has buttons to subscribe and contact support in the top right of the page. They also have the option to report an incident. The navigation buttons include Current Status, Scheduled Maintenance, and System Metrics. Clicking on current status brings you to two sections – Twillio Services and External Connectivity. These sections contain an extensive list of monitored systems.
The Past Incidents button links to a separate page with an extensive breakdown. Incidents are detailed and can be filtered for faster navigation. However, they would benefit from a clear color code to categorize incidents.
Visually, their status page is kept minimal and does not have a color scheme or banner of any kind. However, they do have their logo on the top left of the page.
11. GitHub
Status Page: https://www.githubstatus.com/
What They Do: GitHub is a cloud-based service for version control using Git. Users can collaborate on open-source software projects by being able to store, manage, and share their code with other users.
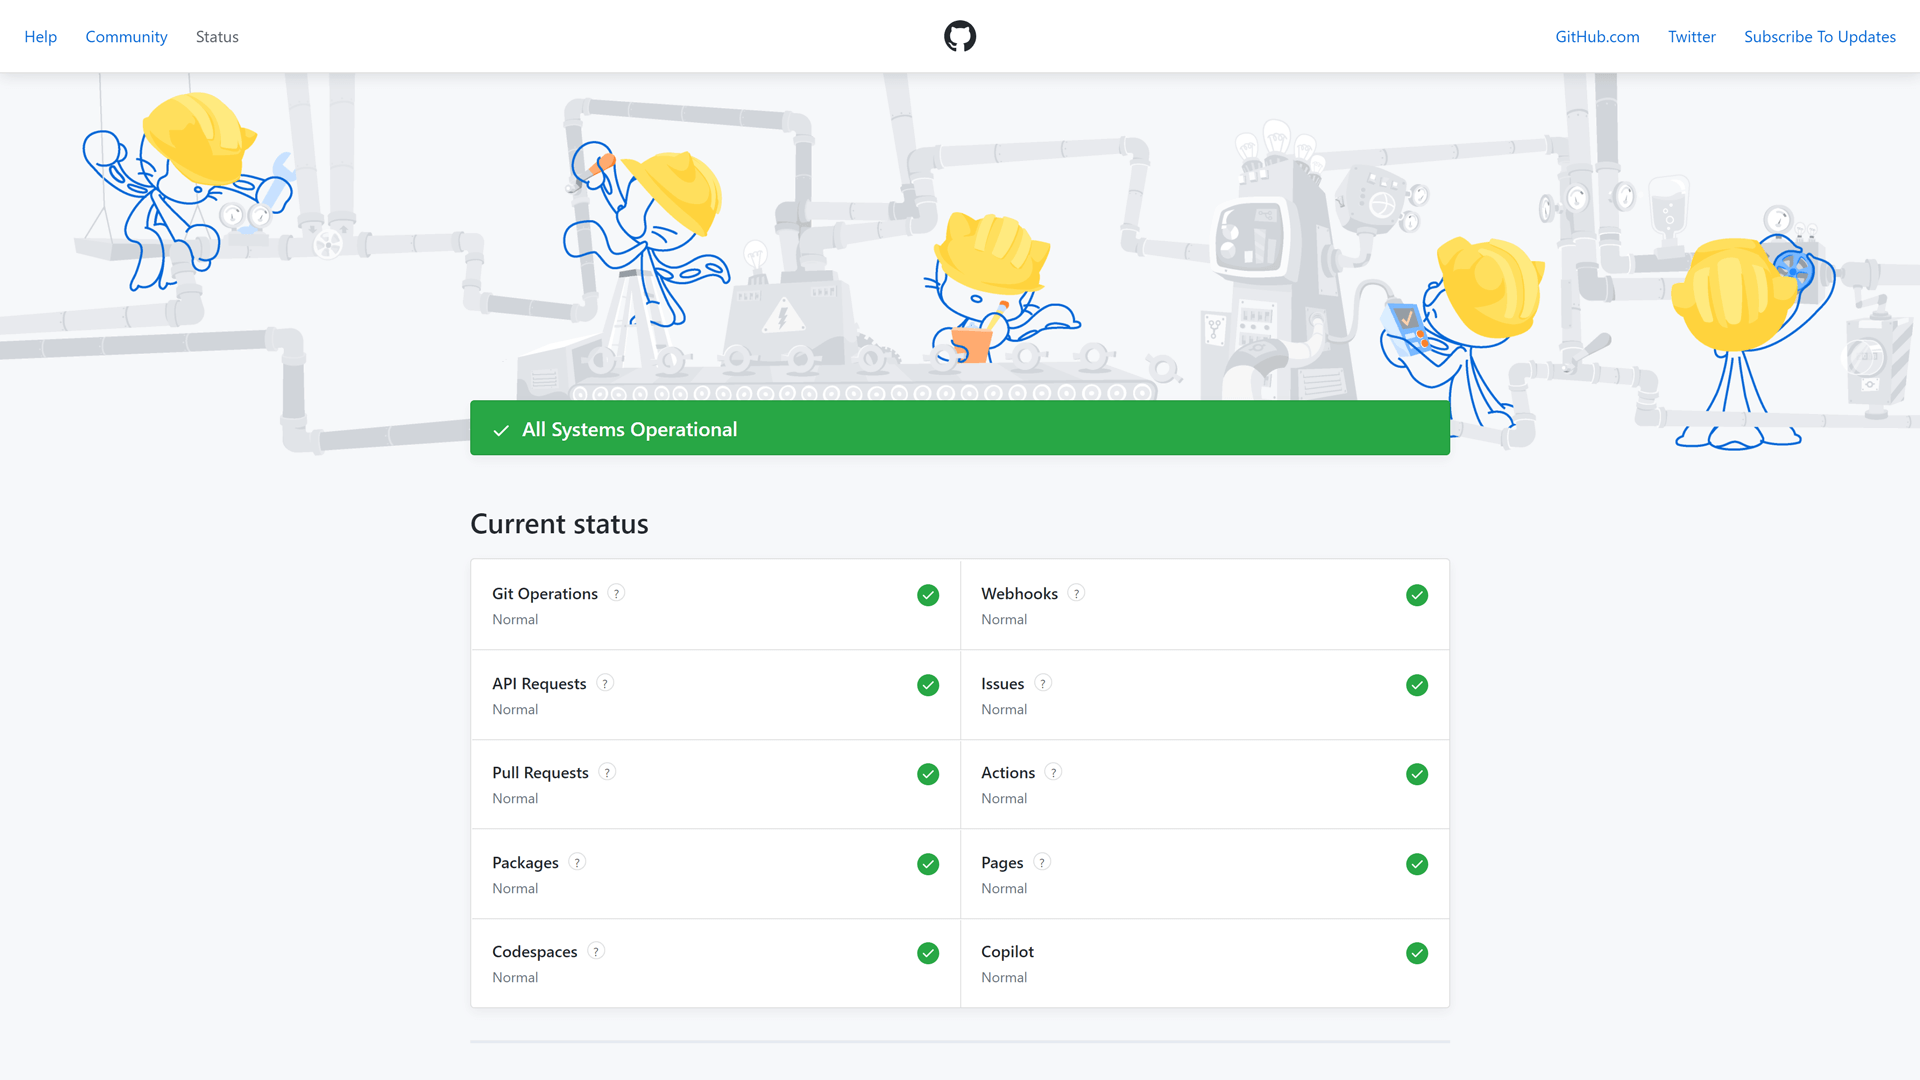
What’s Great About Their Status Page? GitHub’s status page prominently displays the most commonly used components and services. This includes Git Operations, Webhooks, Pull Requests, and more.
Hint icons next to each component help less experienced users understand them. However, to view all components and incident history, users need to scroll. The incident history displays three months at a time. However, there is an option to expand for more details.
The page features a minimalistic branded banner at the top, aligning with GitHub’s identity. However, it requires users to scroll, which could be optimized since only 10 components are displayed. The components lack details for more in-depth information. This page would benefit from including sub-components and regions for more granularity.
Additionally, the status page lacks a clear color scheme. While incidents are highlighted in dark orange or yellow, there’s no explanation of what these colors signify. some incidents are in black text, making it unclear whether they represent incidents or maintenance.
Overall, it’s not a bad status page, considering timely updates and the minimalistic design to a certain degree. However, as we mentioned before in our extensive research on GitHub outages, more information could be provided to improve transparency.
12. Litmus
Status Page: https://status.litmus.com/
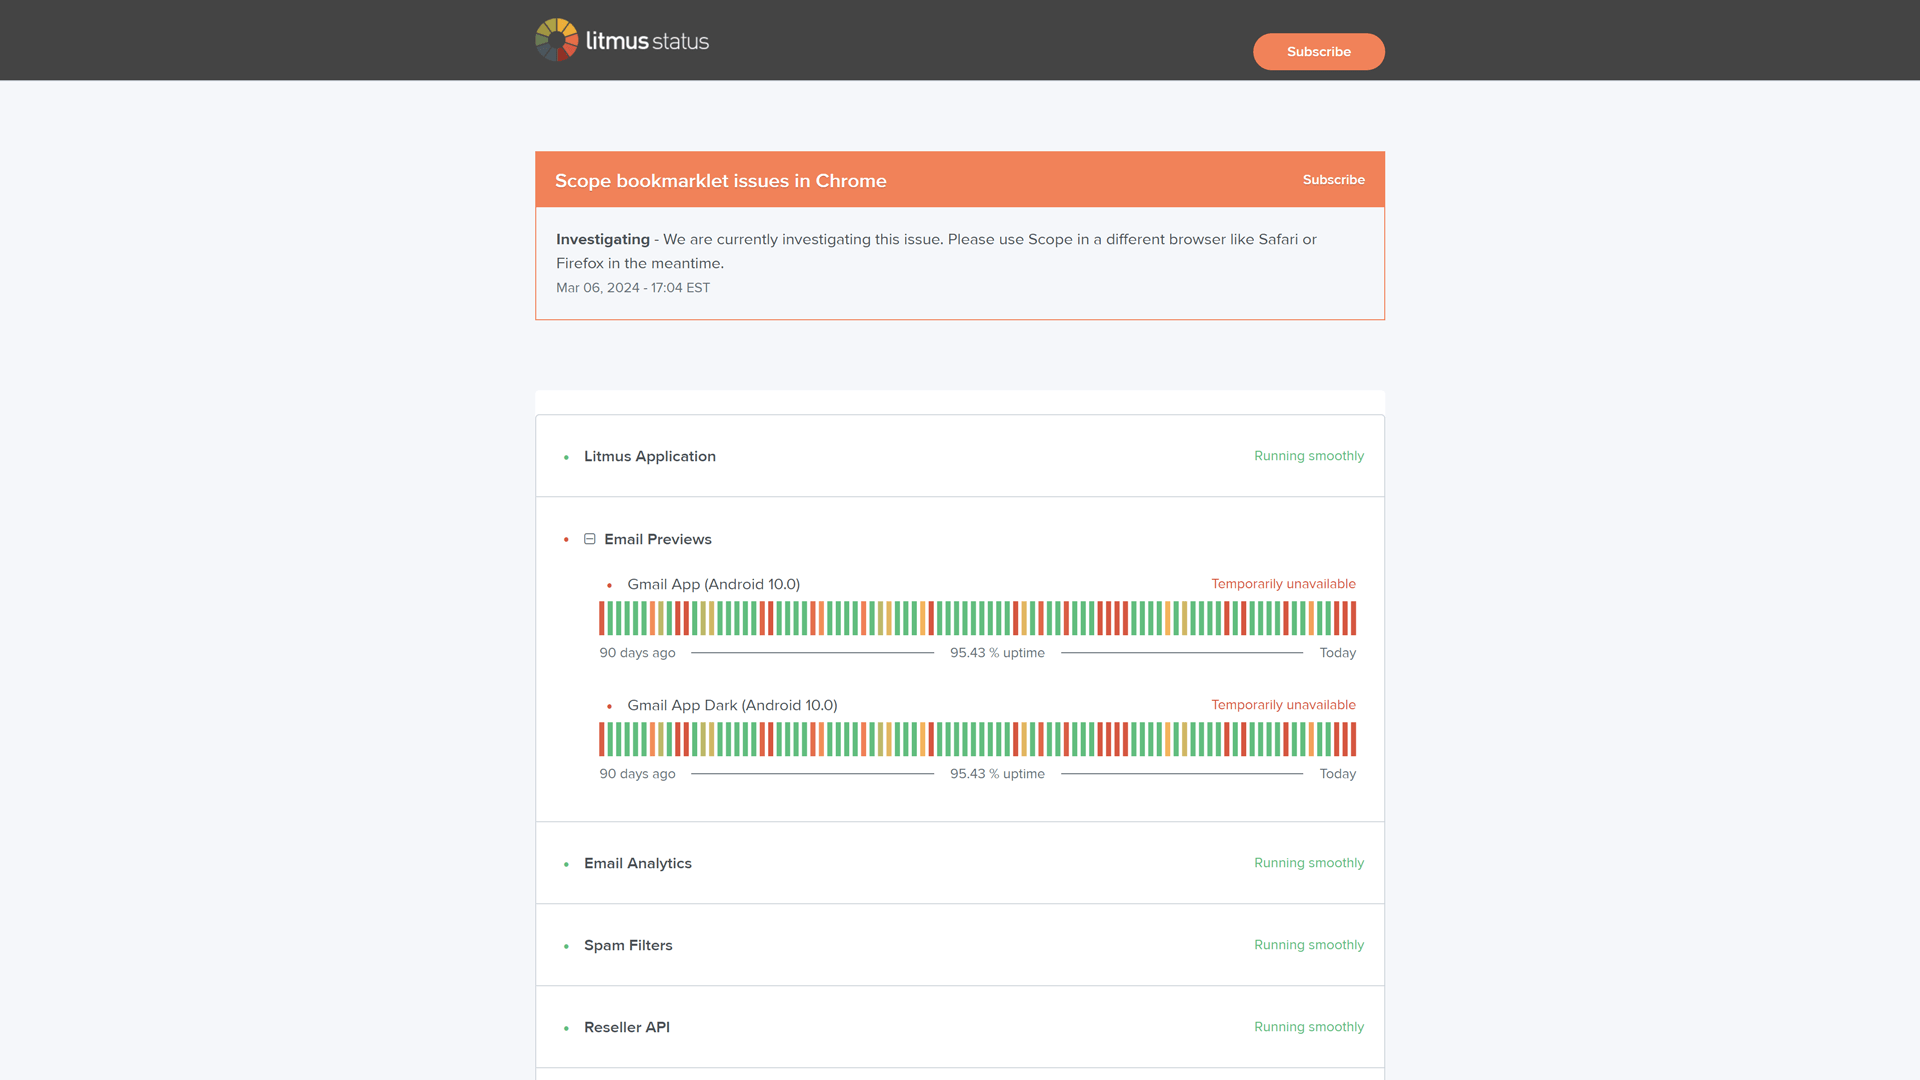
What They Do: Litmus is a marketing platform that allows users to create, personalize, and tailor their customer emails. As a result of optimizing their emails with Litmus, marketers are more likely to get the most out of their email chains.
What’s Great About Their Status Page? Their Atlassian status page is tailored to their identity without being the main takeaway of the page or an overbearing feature. They have a subscription button and their logo. Additionally, there is a professional banner at the bottom that matches their identity.
Despite this, the rest of the page is neutral, meaning these features relating to their identity do not take over the page. Status information for their services is listed with a 90-day uptime in the form of bars.
Their incident history is extensive. Similar to other status page examples that use Atlassian’s Statuspage, they show 3 months at a time. Components can be filtered to help users navigate incidents. Uptime history can also be viewed.
Overall, they display a compact view of 90-day history, which is a positive feature aimed at transparency. However, in the past when we have visited the page, they have experienced issues. When these incidents occurred, it did not clarify what type of incident it was, or any other useful details. This would be beneficial for Litmus to focus on.
13. NoCodeOps
Status Page: https://www.nocodeoutages.com/
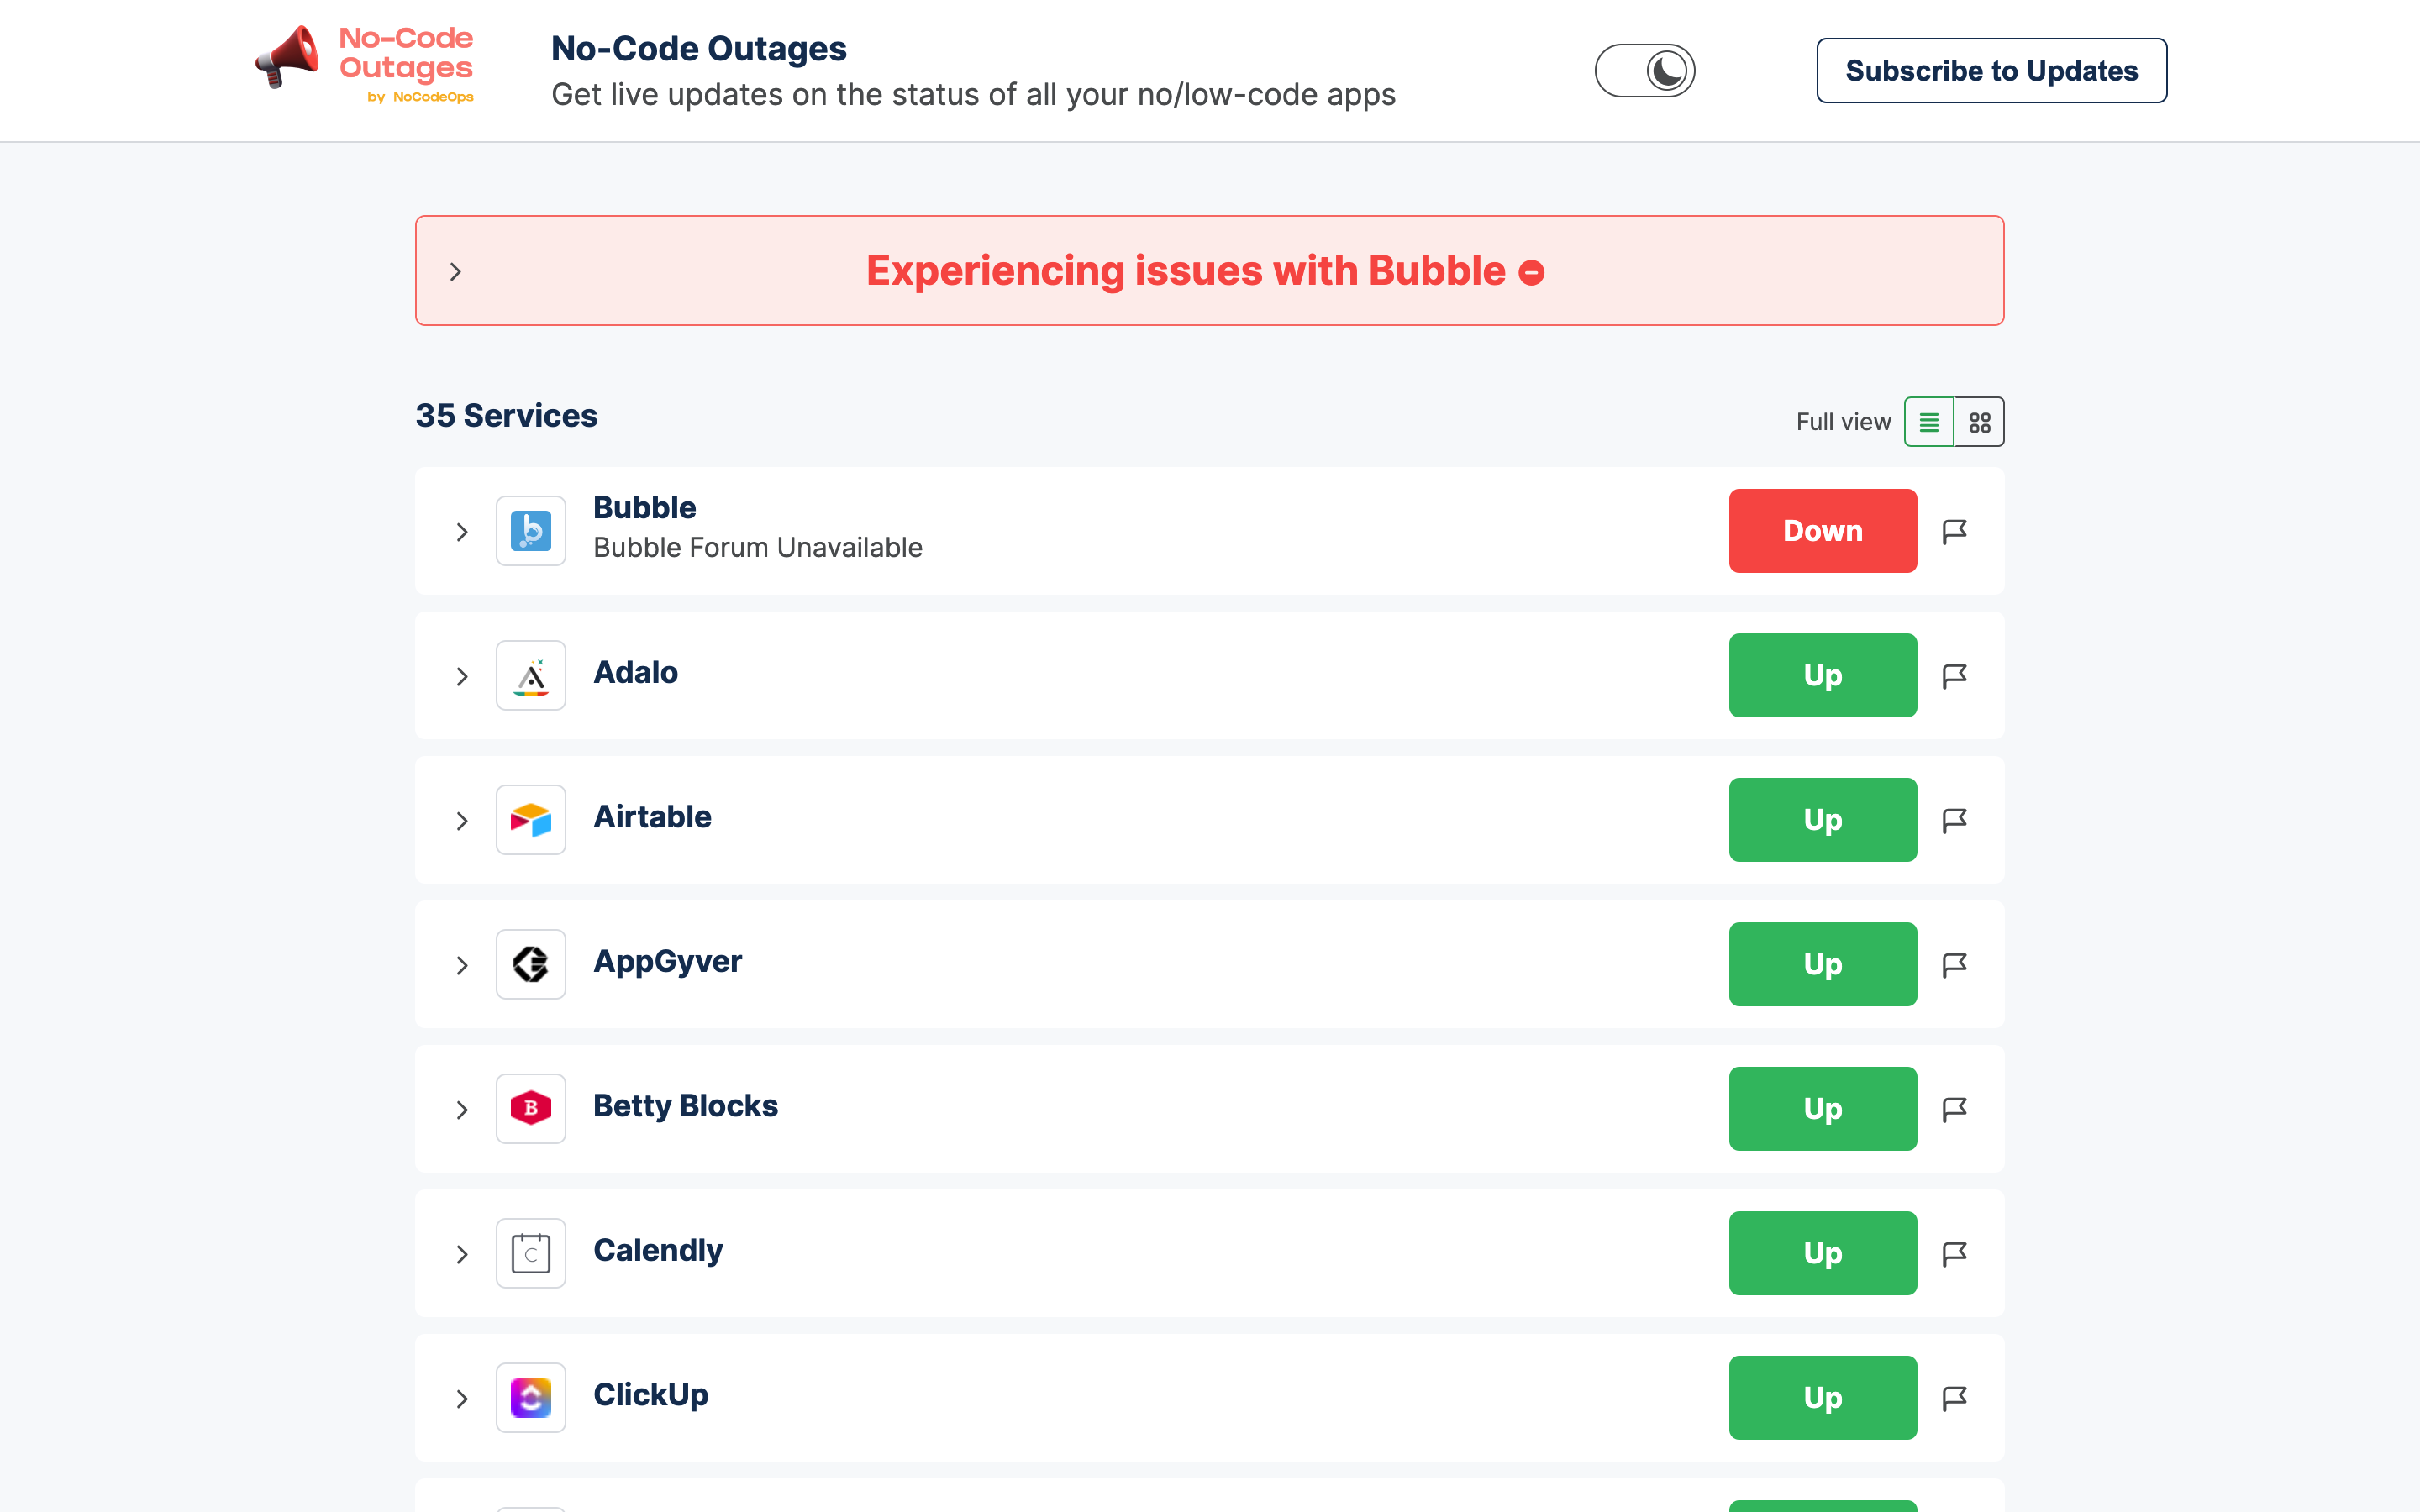
What They Do: NoCodeOps, a tool for no-code developers, uses StatusGator to monitor popular services and no-code tools and aggregate them into one place for convenience.
What’s Great About Their Status Page? NoCodeOps monitors 35 different services. These services are listed on their status page with drop-down menus showing the status of individual service components. Users can switch to the history tab for each service, which displays a 30-day uptime history with a clear color code categorizing events.
Furthermore, the page is eye-catching but remains functional and easy to navigate. There are buttons to switch to dark mode, and an option to switch between grid and compact view. Users can subscribe to receive instant updates. There is also a flag icon next to each service to report any issues.
However, one room for improvement would be for NoCodeOps to display an extended incident history. This would work toward further transparency and help users gain insight into reliability.
Overall, NoCodeOps has a clear and transparent status page with all its services and third-party services listed. Incidents are updated with detail and the page is easy to navigate, with many features helping with functionality. Possible improvements would be for NoCodeOps to display a more extensive incident history and have a typical naming for their status page.
Community and Communication Status Page Examples
1. Reddit
Status Page: https://www.redditstatus.com/
What They Do: Reddit is a well-known social media platform that allows networks of communities to discuss and share social content.
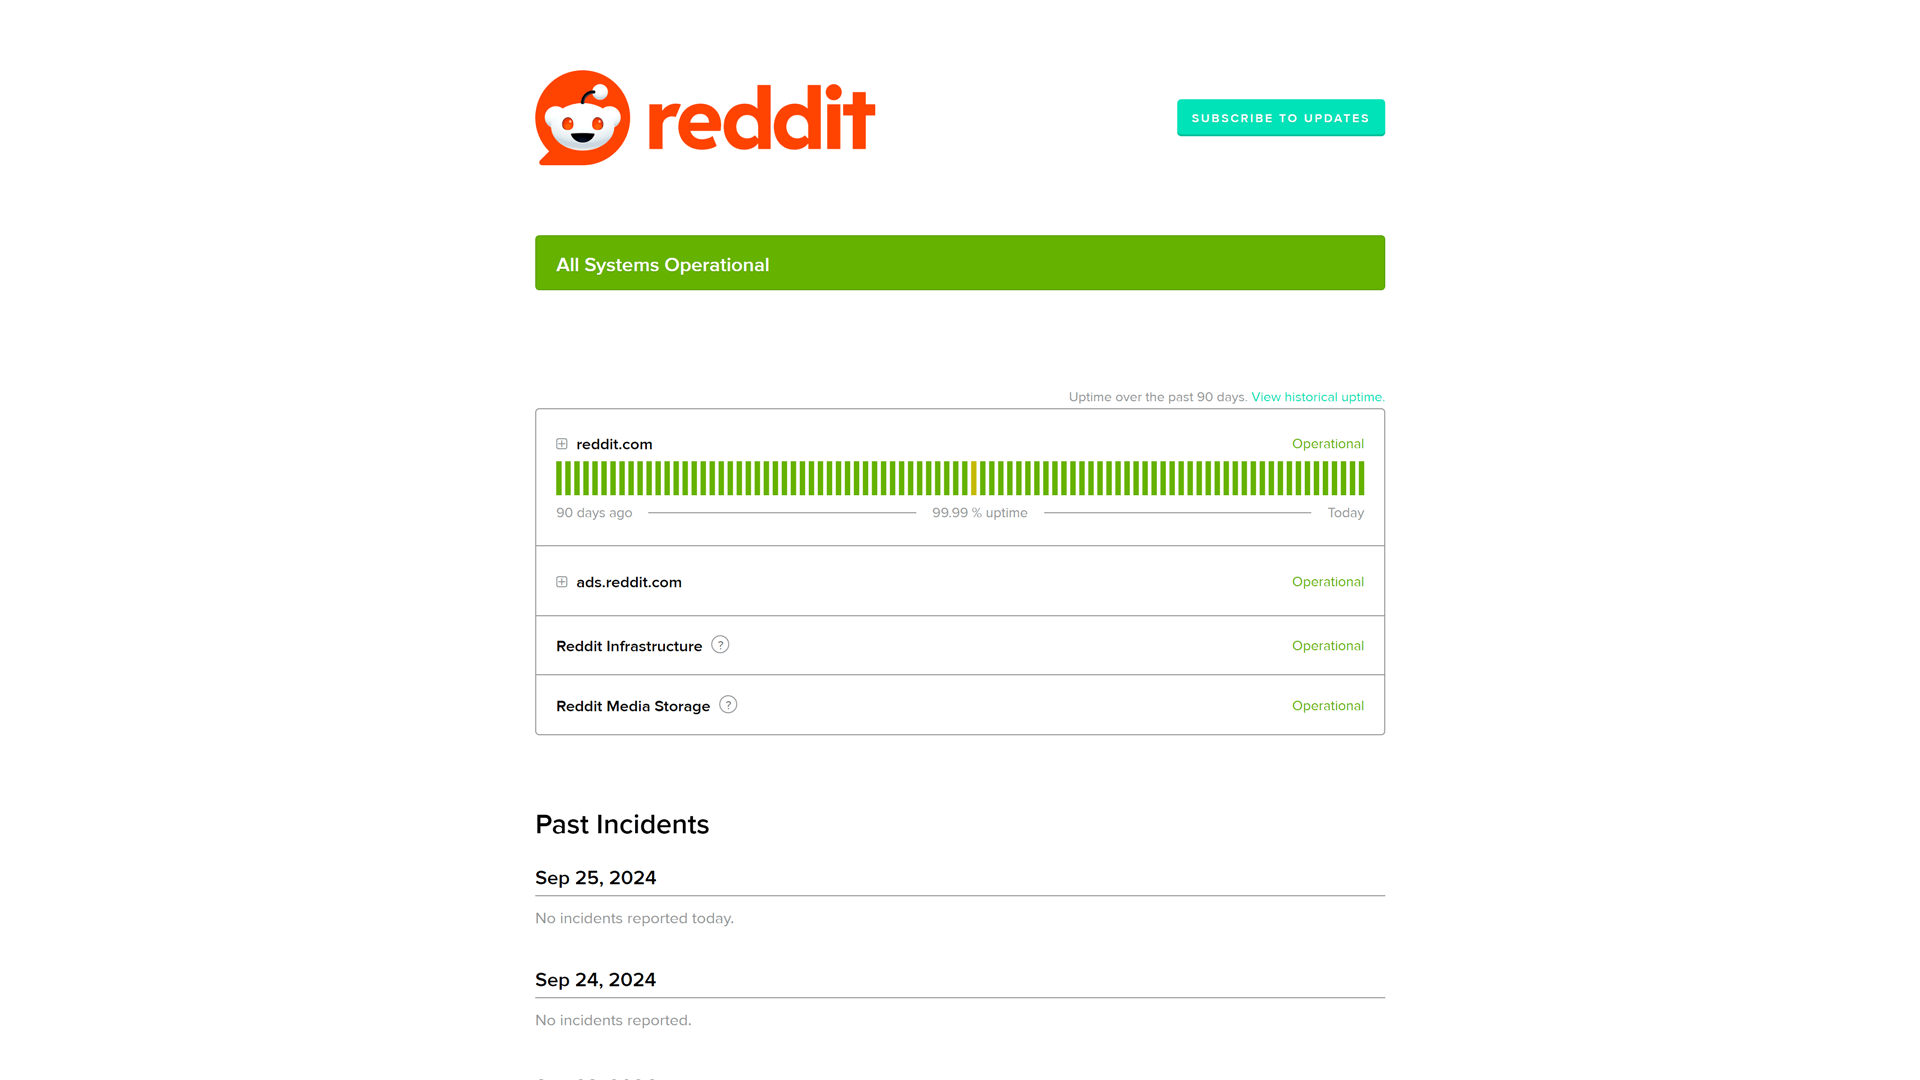
What’s Great About Their Status Page? Their Atlassian status page displays both historical uptime and extensive incident history. 3 systems are being monitored:
- Reddit.com
- Reddit Infrastructure
- Reddit Media Storage
Reddit’s status page covers all attributes of the website, such as votes, spam, and comment processing. These components can be seen when the user clicks on the drop-down icon. The status of each component is paired with a 90-day uptime history in the form of bars. There is no explanation of the status color code, though. We can assume red means an outage and orange means an incident, but this isn’t clarified.
There is a 2-week incident history and a link to a more extensive list that shows 3 months at a time. Incident reports are detailed and informative, with appropriate time stamps.
Overall, their page is easy to navigate and shows a good amount of information. They have a subscribe to updates button and their logo to match their identity. However, like some other status page examples we have looked at, it would be beneficial if their logo was smaller. This is not a big issue, however.
2. Skype
Status Page: https://portal.office.com/servicestatus
What They Do: Skype is a well-known communication software that allows users to make free video calls. They have around 300 million monthly active users.
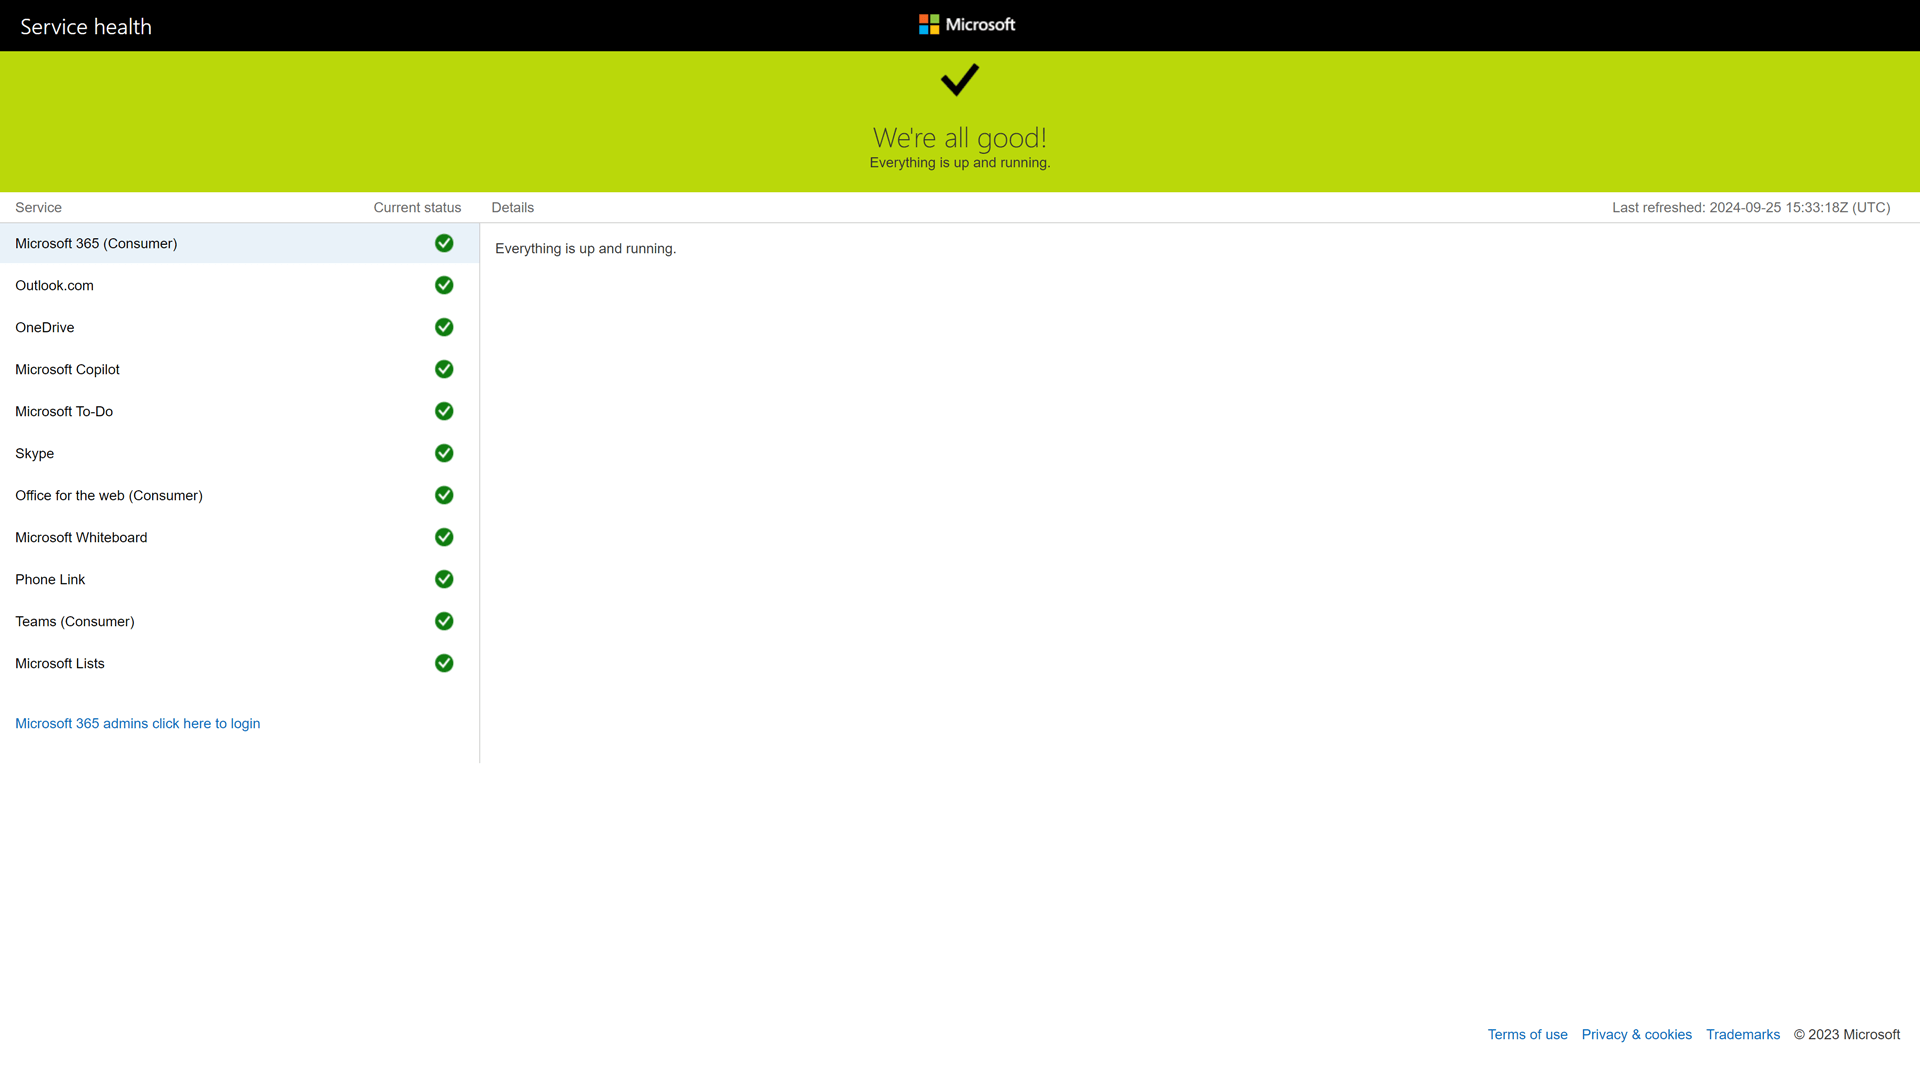
What’s Great About Their Status Page? Skype’s status page is tailored to its identity with a blue theme but remains minimalist too. They have a large blue banner at the top of the page which shows the service is functioning normally.
Additionally, there is a blue button underneath that can be used to raise an issue. This is obvious to the users and is a useful feature to include. The services being monitored are listed alongside icons detailing what exactly that service is. The current status of that service accompanies these. There is also a menu above the page banner which has buttons for Downloads, Skype to Phone, Skype Number, and Skype Support.
However, there is room for improvement. There is no option to view incident history or uptime. Only the current statuses of their systems are shown. This would be beneficial for Skype’s transparency, as many other status page examples have this included. There is also no option to subscribe to updates.
Overall, it is a straightforward status page tailored to Skype’s identity. However, it has room for more information, namely incident history.
3. Slack
Status Page: https://status.slack.com/
What They Do: They provide an instant messaging platform for business communications. With Slack, many organizations can communicate more efficiently and securely in the workplace.
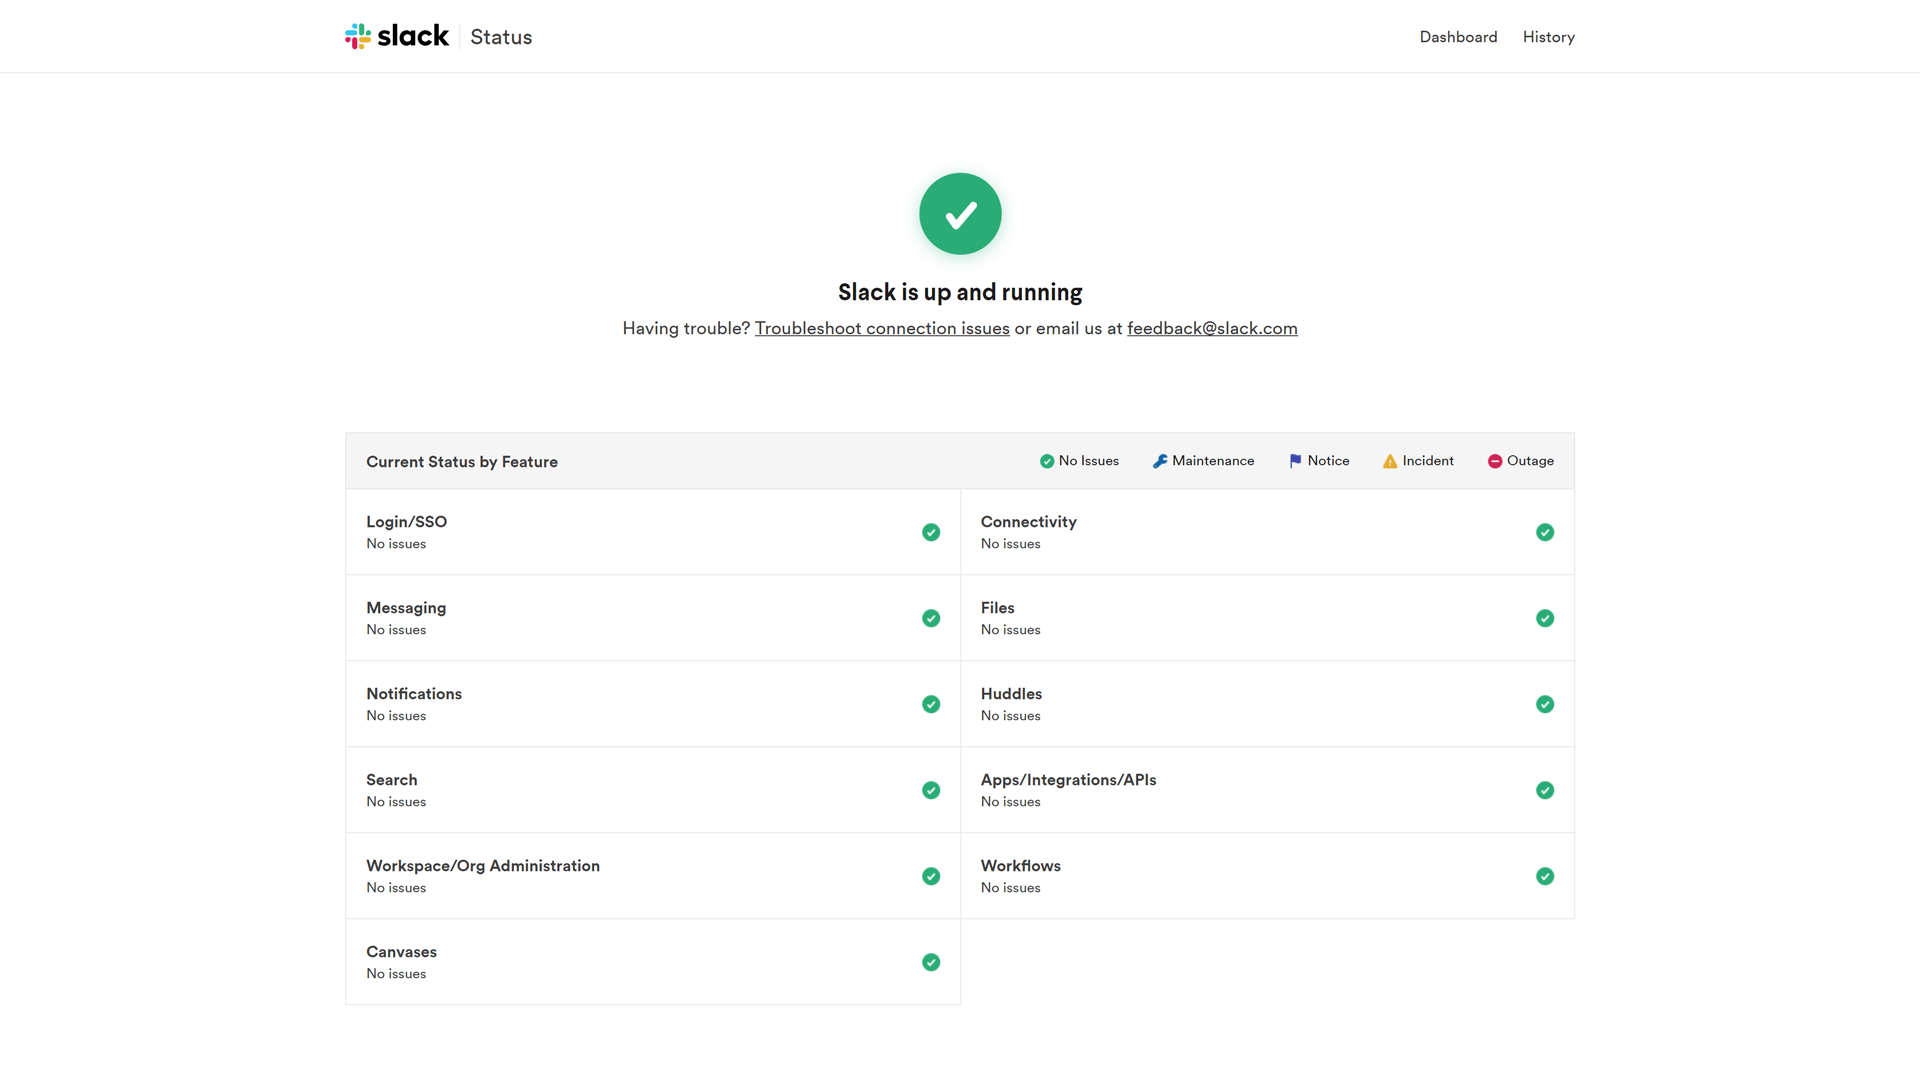
What’s Great About Their Status Page? Slack’s status page is straight to the point with a clear color code and a list of services with statuses. Additionally, there’s a display of the quarterly uptime in percent. They also have a link to report an issue under the main page heading, so it is easily available to users who wish to report an issue.
There are Dashboard, History, and Twitter buttons in the top right corner.
- The Dashboard leads you back to the status home page
- History leads you to the extensive reports on past incident
- Twitter leads you to Slack’s Twitter account dedicated to status updates
Their incident history covers one year. This may not be as extensive as other status page examples in this list, but it still covers all events (Maintenance, Incidents, Outages).
However, one room for improvement is to make events more obvious. The history shows a calendar view, and icons to display events are on the smaller side. See below. As you can see, the icons could be made more obvious.
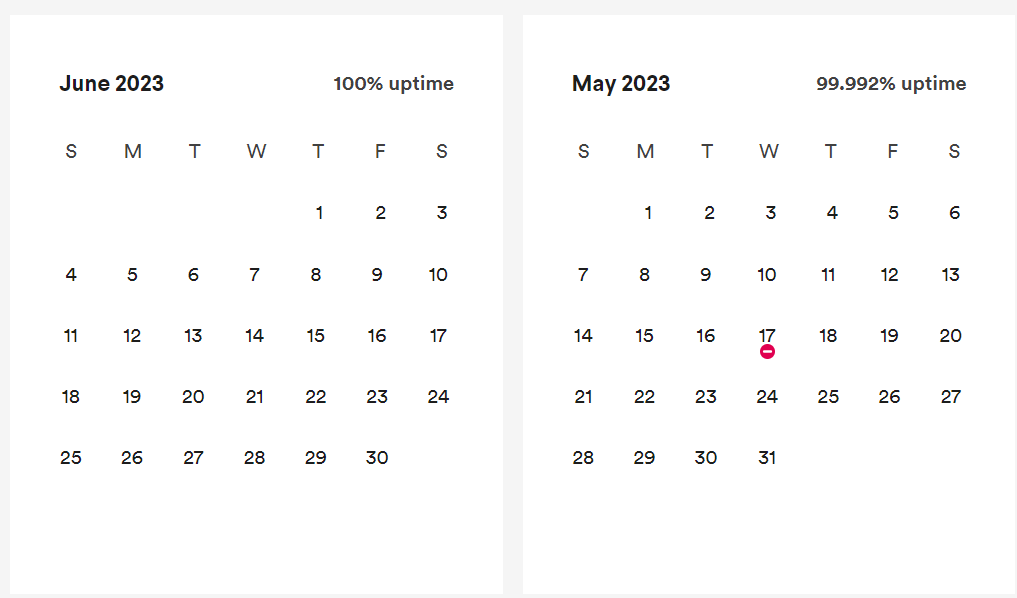
They have a link for users to troubleshoot their issues, which is a unique feature. They also have some text under the status data where users can click to subscribe, but this could be made more obvious.
One additional suggestion for Slack is to show planned maintenance events. It would be beneficial to users so they can plan around these events.
Overall, this status page example gets straight to the point. However, some changes could be made to make features more obvious, such as the subscribe section and incident history icons.
Fintech Status Page Examples
1. PayPal
Status Page: https://www.paypal-status.com/product/production
What They Do: PayPal is a world-famous online payment system. PayPal products and services range from online checkout services to cryptocurrency transactions. They operate over 430 million active accounts in more than 200 countries, with an estimated 35 million being merchant accounts.
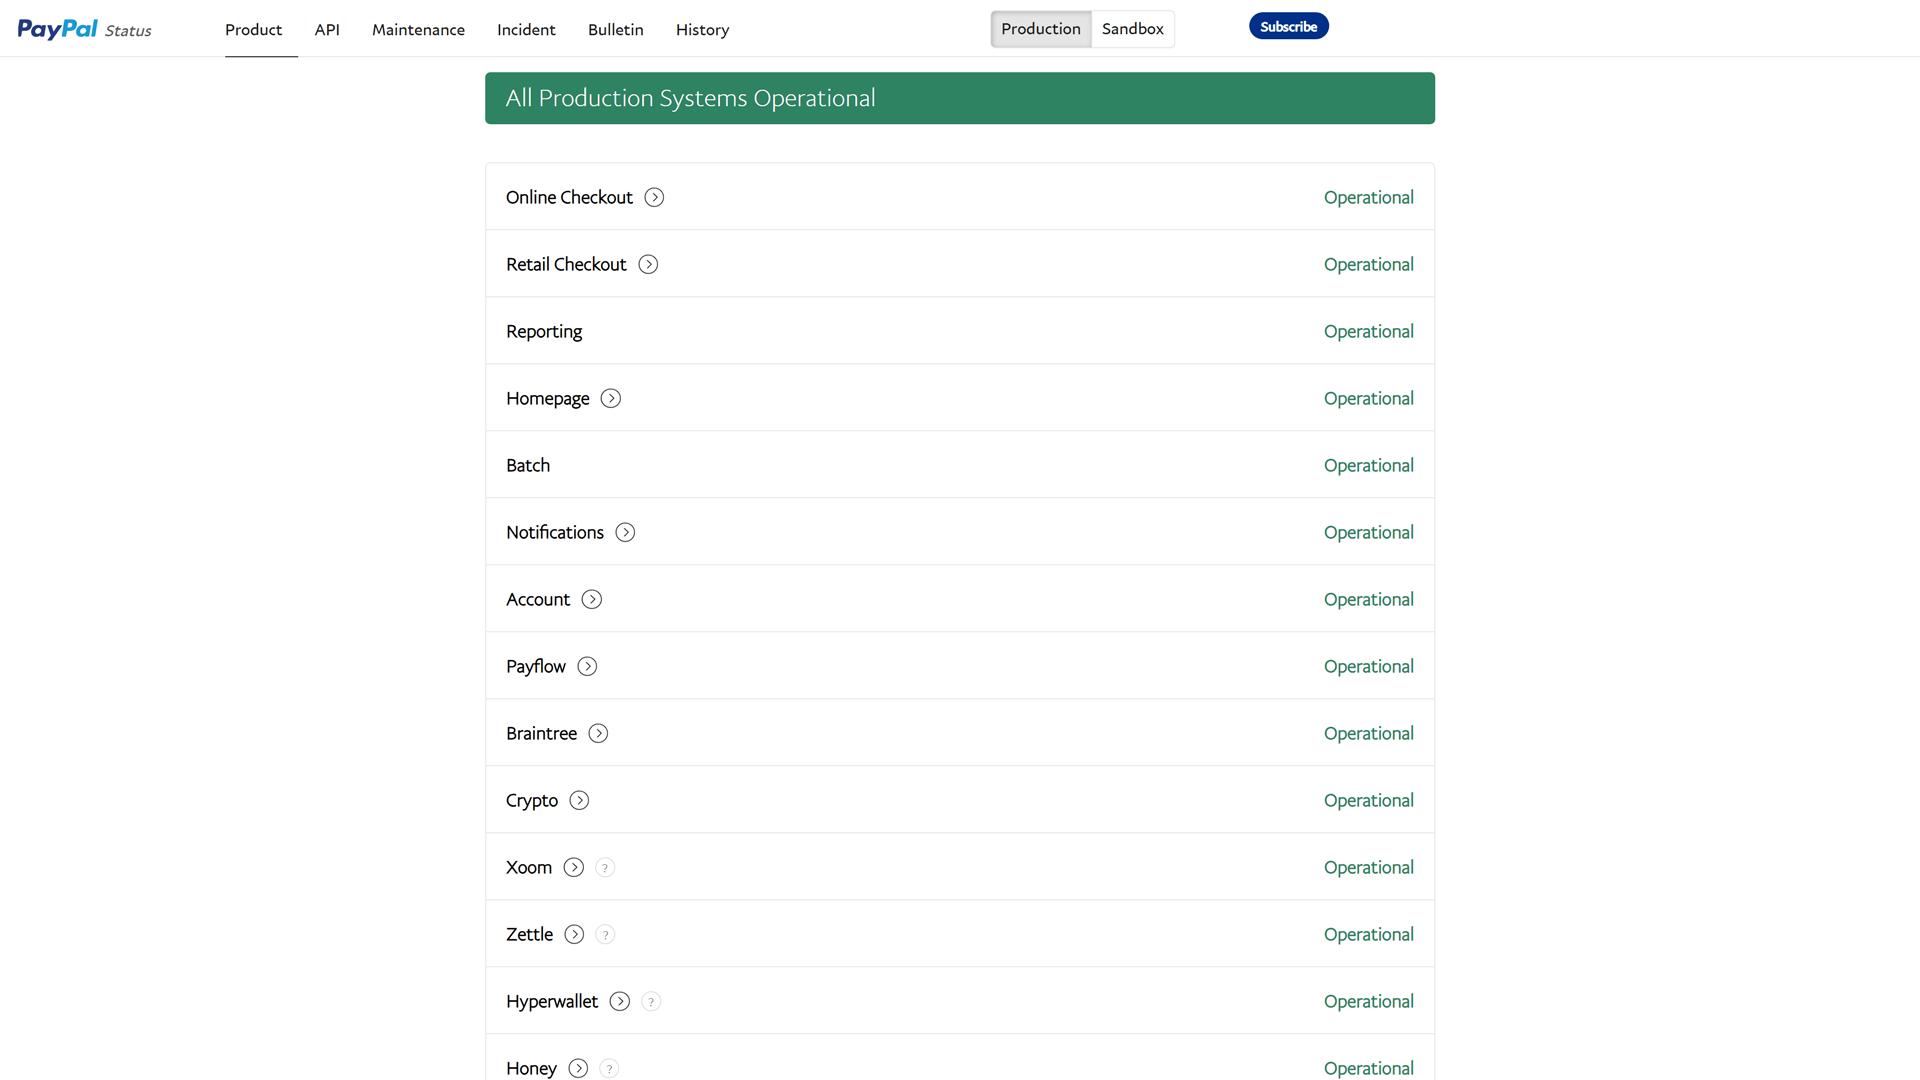
What’s Great About Their Status Page? PayPal’s status page has sections split into tabs for easier navigation. Users can also switch between production and sandbox status updates.
The first tab is the Products, which lists components such as online and retail checkout, notifications, etc.
API statuses are in a separate tab and include types of APIs PayPal uses with their sub-categories statuses. There’s a tab for incidents and a separate one for maintenance. There is also a handy bulletin tab that addresses any recent incidents if a user wants details. The final tab is an incident history for the past 60 days.
Their 60-day incident history chart distinguishes between incidents and downtime. However, their incident log only has small, faint icons that could be more obvious.
Service statuses and a subscribe button in the top right of the website could be more eye-catching. PayPal has handy pop-up windows to guide users through their status page. However, these can delay a user getting information regarding an incident if it’s not their first visit.
2. Coinbase
Status Page: https://coinbase.statuspage.io/
What They Do: Coinbase is a secure online platform for the exchange and management of cryptocurrency.
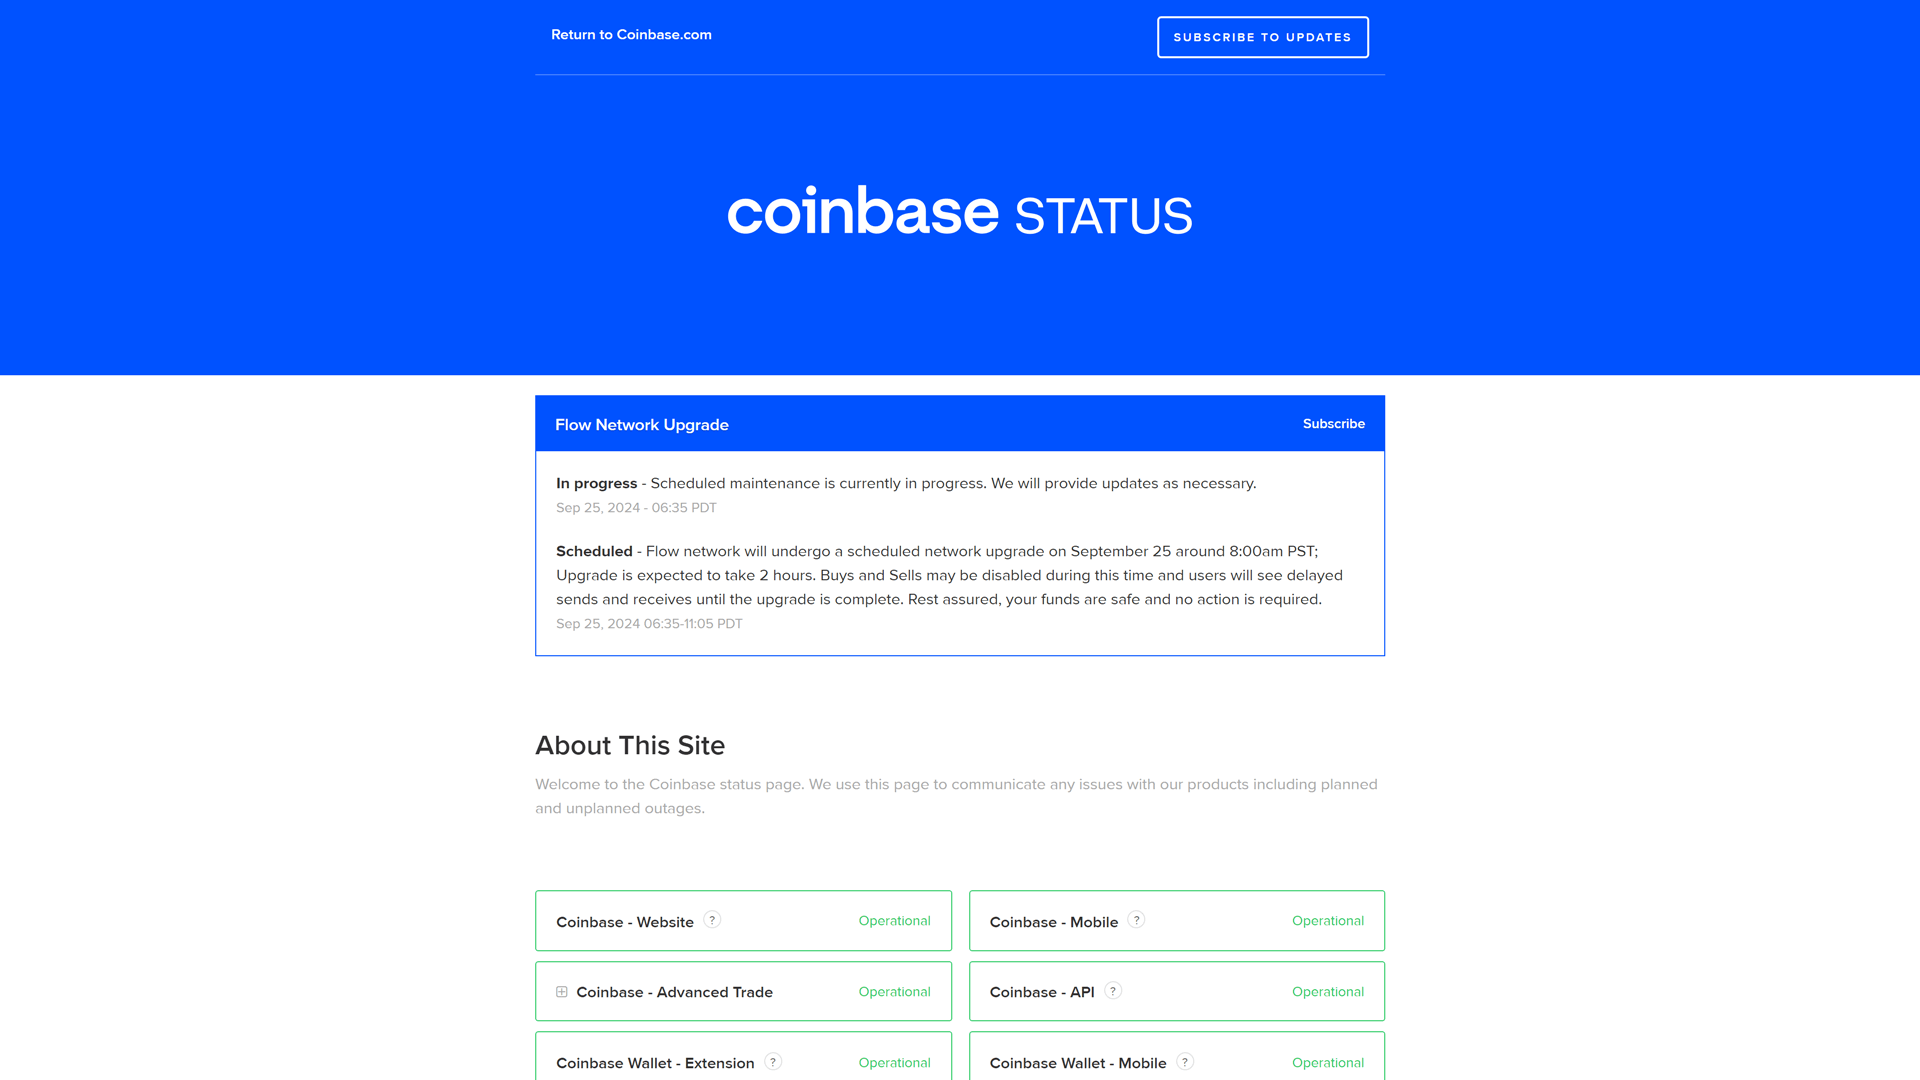
What’s Great About Their Status Page? Their status page has an extensive list of systems being monitored, with dropdown menus showing the statuses of individual system components.
Users can easily navigate between the statuses of the components. There are icons next to each component that inform on the component’s functionality upon the hover of the pointer.
Since they have an Atlassian status page, Coinbase displays an extensive incident history showing three months at a time. However, unlike some of the other examples of Atlassian status pages we’ve discussed earlier, there’s a missing filter option here. It would also greatly enhance clarity if incidents were color-coded for easy categorization.
The status page welcomes users with a prominent blue banner featuring the Coinbase logo. However, its size affects the visibility of statuses, so it could be resized. The subscription button also blends with the blue background and is not visible.
Overall, Coinbase’s status page is efficient in conveying essential information and incident history. However, there’s room for visual and functional refinement. Specifically, a more compact blue banner, adding a filter option in the history view, and a more visible subscription button could enhance the page’s usability.
3. Intuit
Status Page: https://status.developer.intuit.com/
What They Do: Intuit is software that aims to make financial management for businesses easier.
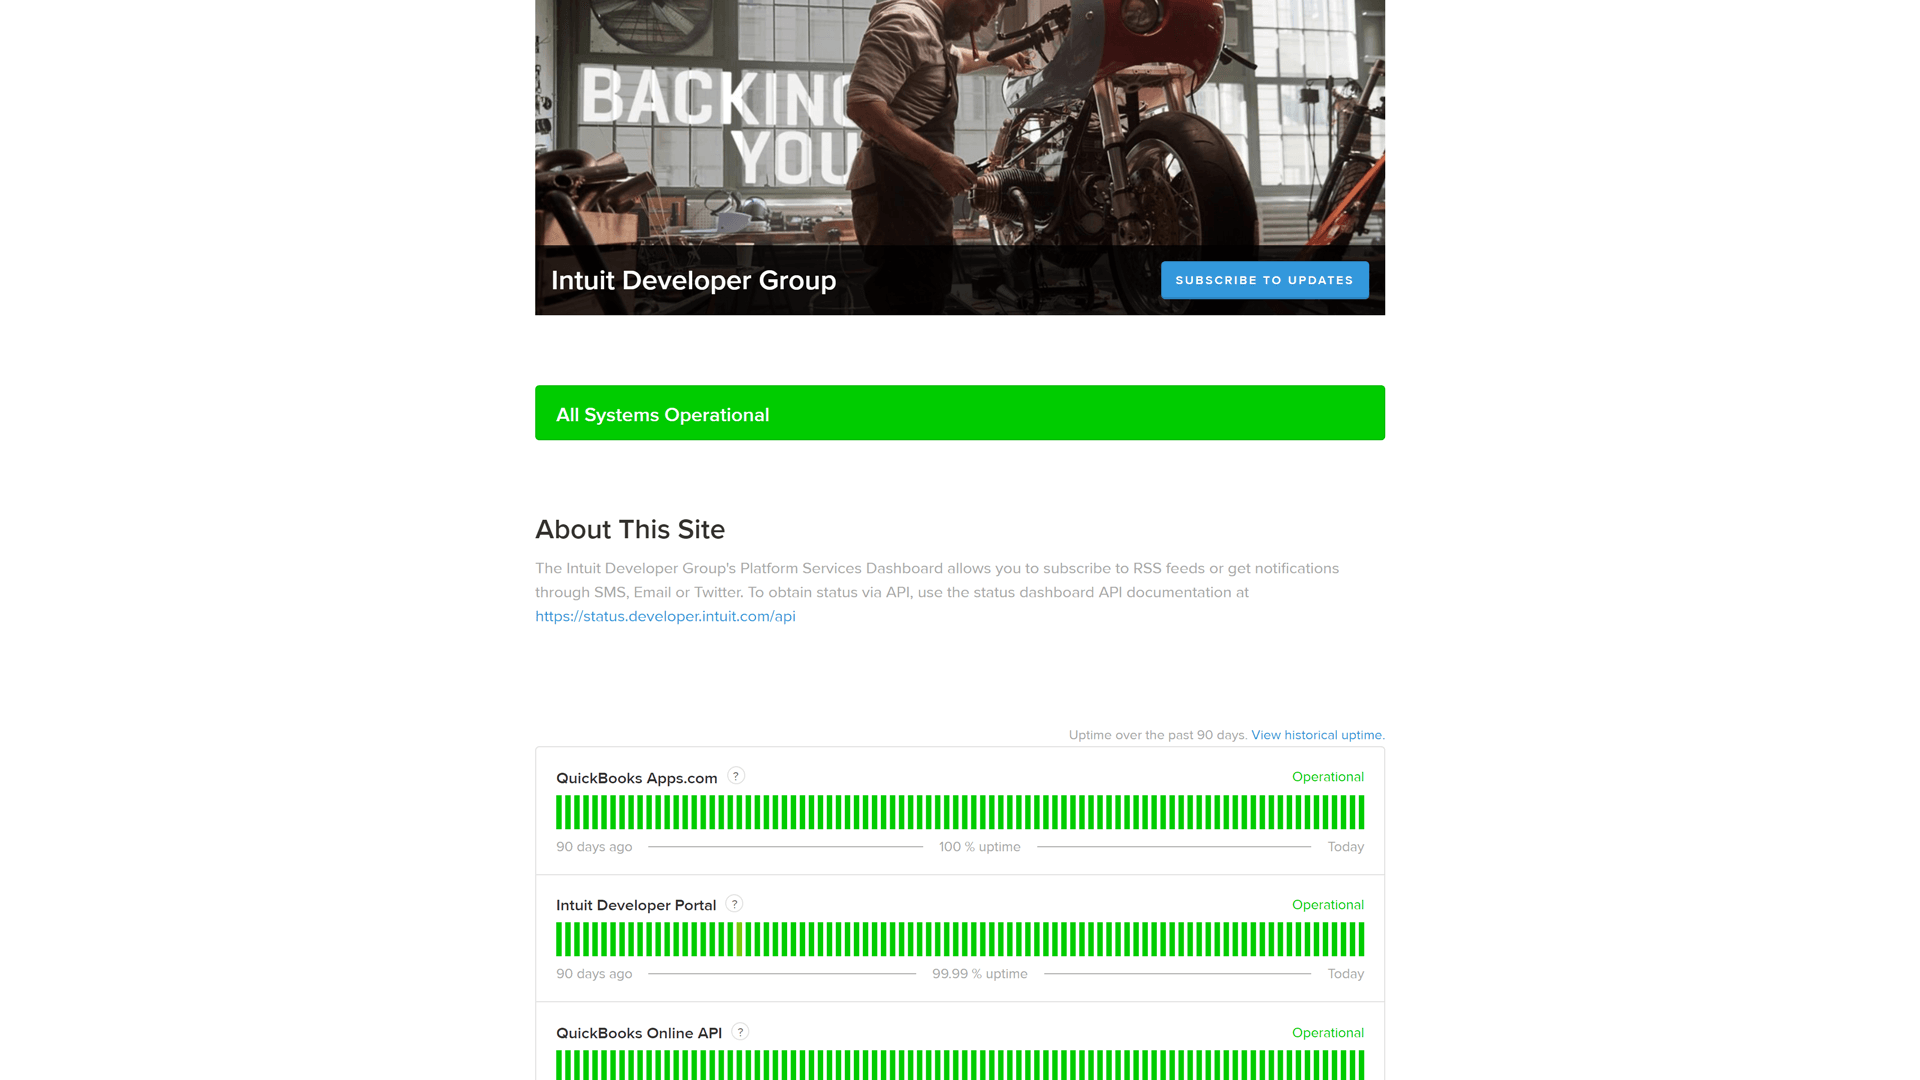
What’s Great About Their Status Page? Their status page displays a compact view of a 90-day uptime history for each service they provide. Additionally, they have information icons next to each service to explain what each service is.
There are 2-weeks of historical overviews under the lists with Intuit services. Incident and uptime history are available and show 3 months at a time. Users can also filter search results and change the period shown. Incidents follow a clear and scalable timeline and have sufficient amounts of detail to explain incidents.
One unique aspect of this status page example is that there is a link to a separate status page for developers. It is a useful feature for users, as it is not a typical status page. This can provide developers with useful information regarding system status. Intuit also has a Quickbooks status page.
Overall, this is an informative status page, but the formatting and the layout of its contents could be improved. The banner could take less space so that more information was available to users on the first screen.
4. Square
Status Page: https://www.issquareup.com/
What They Do: They offer financial solutions to businesses, primarily for payment processing. This involves a range of software and hardware. They combine in-person and online payment processing to offer businesses an all-in-one solution to manage financials.
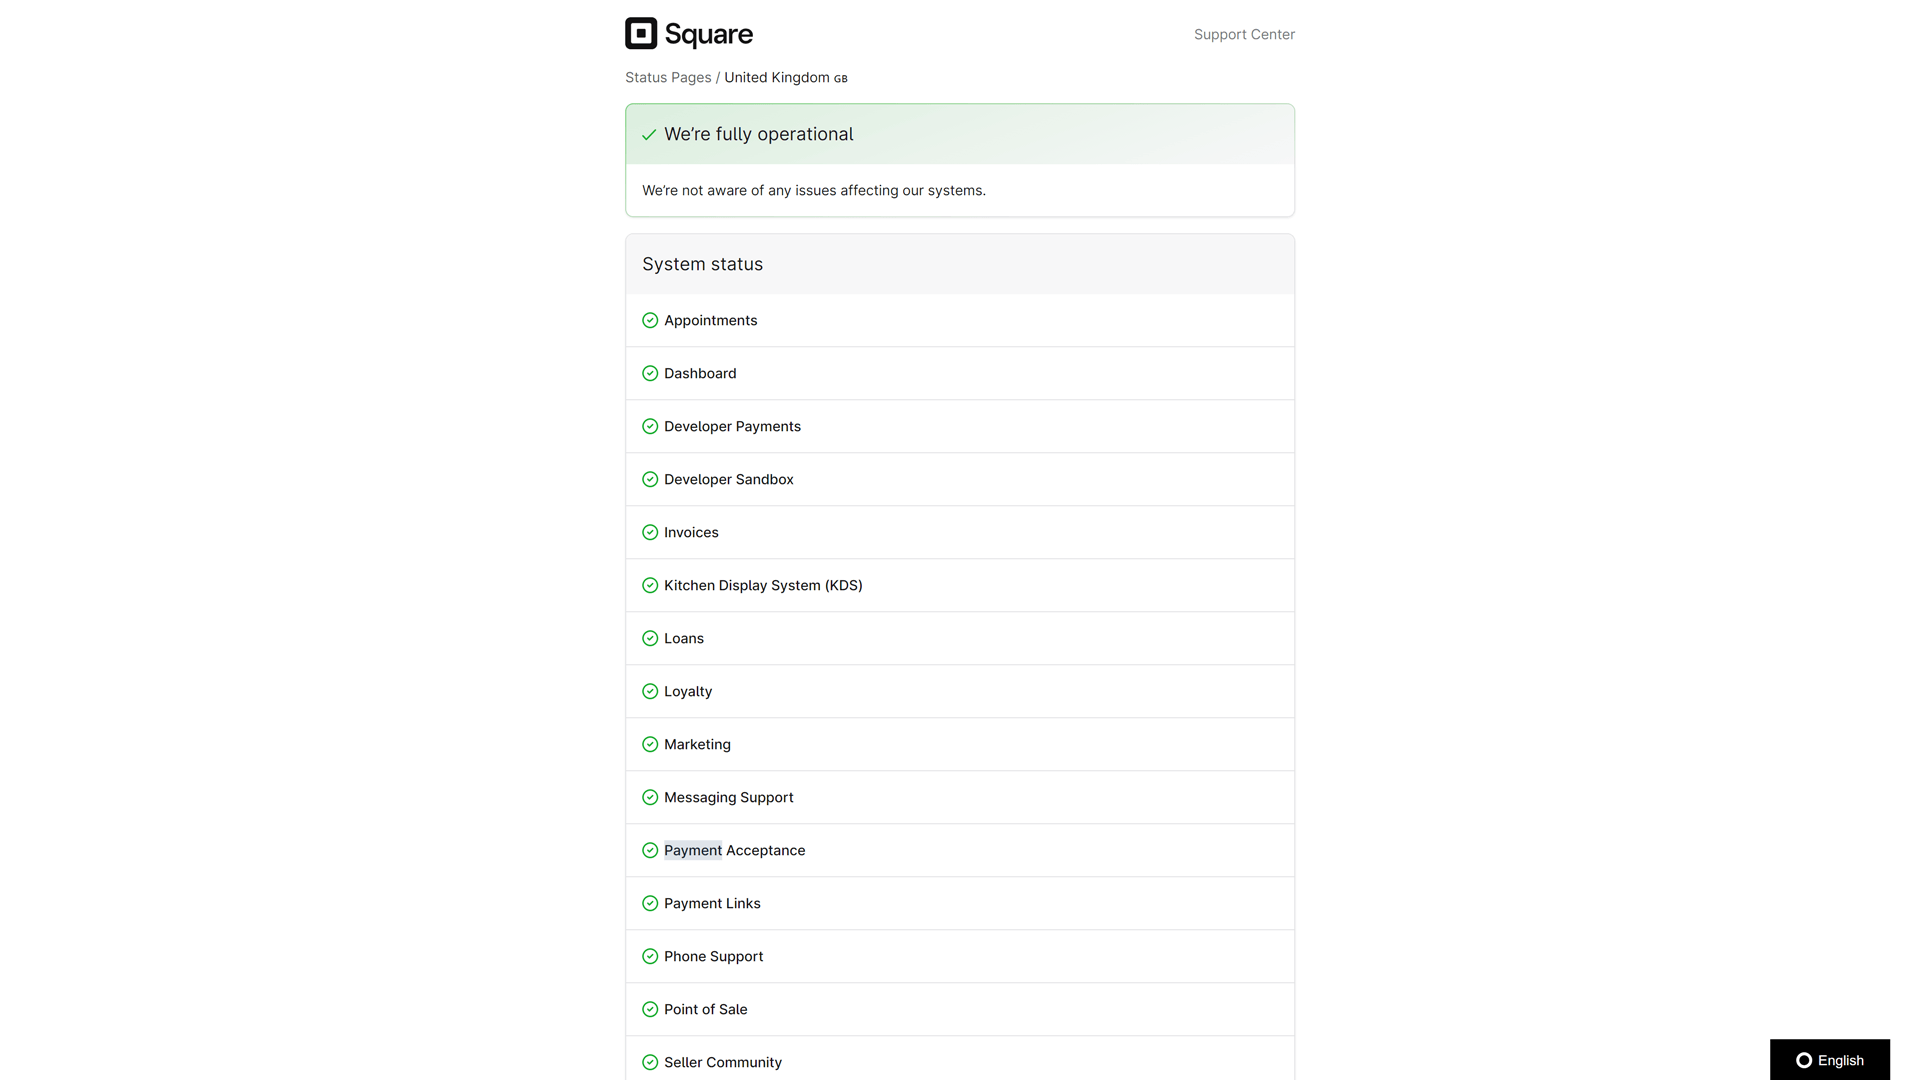
What’s Great About Their Status Page? Their page is more eye-catching than many other status page examples, as it uses various-sized fonts and colors to enhance its visual aspects. Next to each component, they are saying ‘Everything’s great!’ instead of repeating their main visible message ‘operational’.
Square incident history and system statuses are well organized and laid out. They are clear, straightforward, and to the point. System names are a bit vague and could be more detailed. The incident history is also detailed and to the point.
Overall, more visual features would be beneficial. However, this is not a drawback as the page itself is still clear and informative. However, during disruption, events become the first thing displayed on the page. Whilst this makes sense to alert users immediately, it does take up a lot of the page and could be less overbearing.
E-Commerce
1. Shopify
Status Page: https://www.shopifystatus.com/
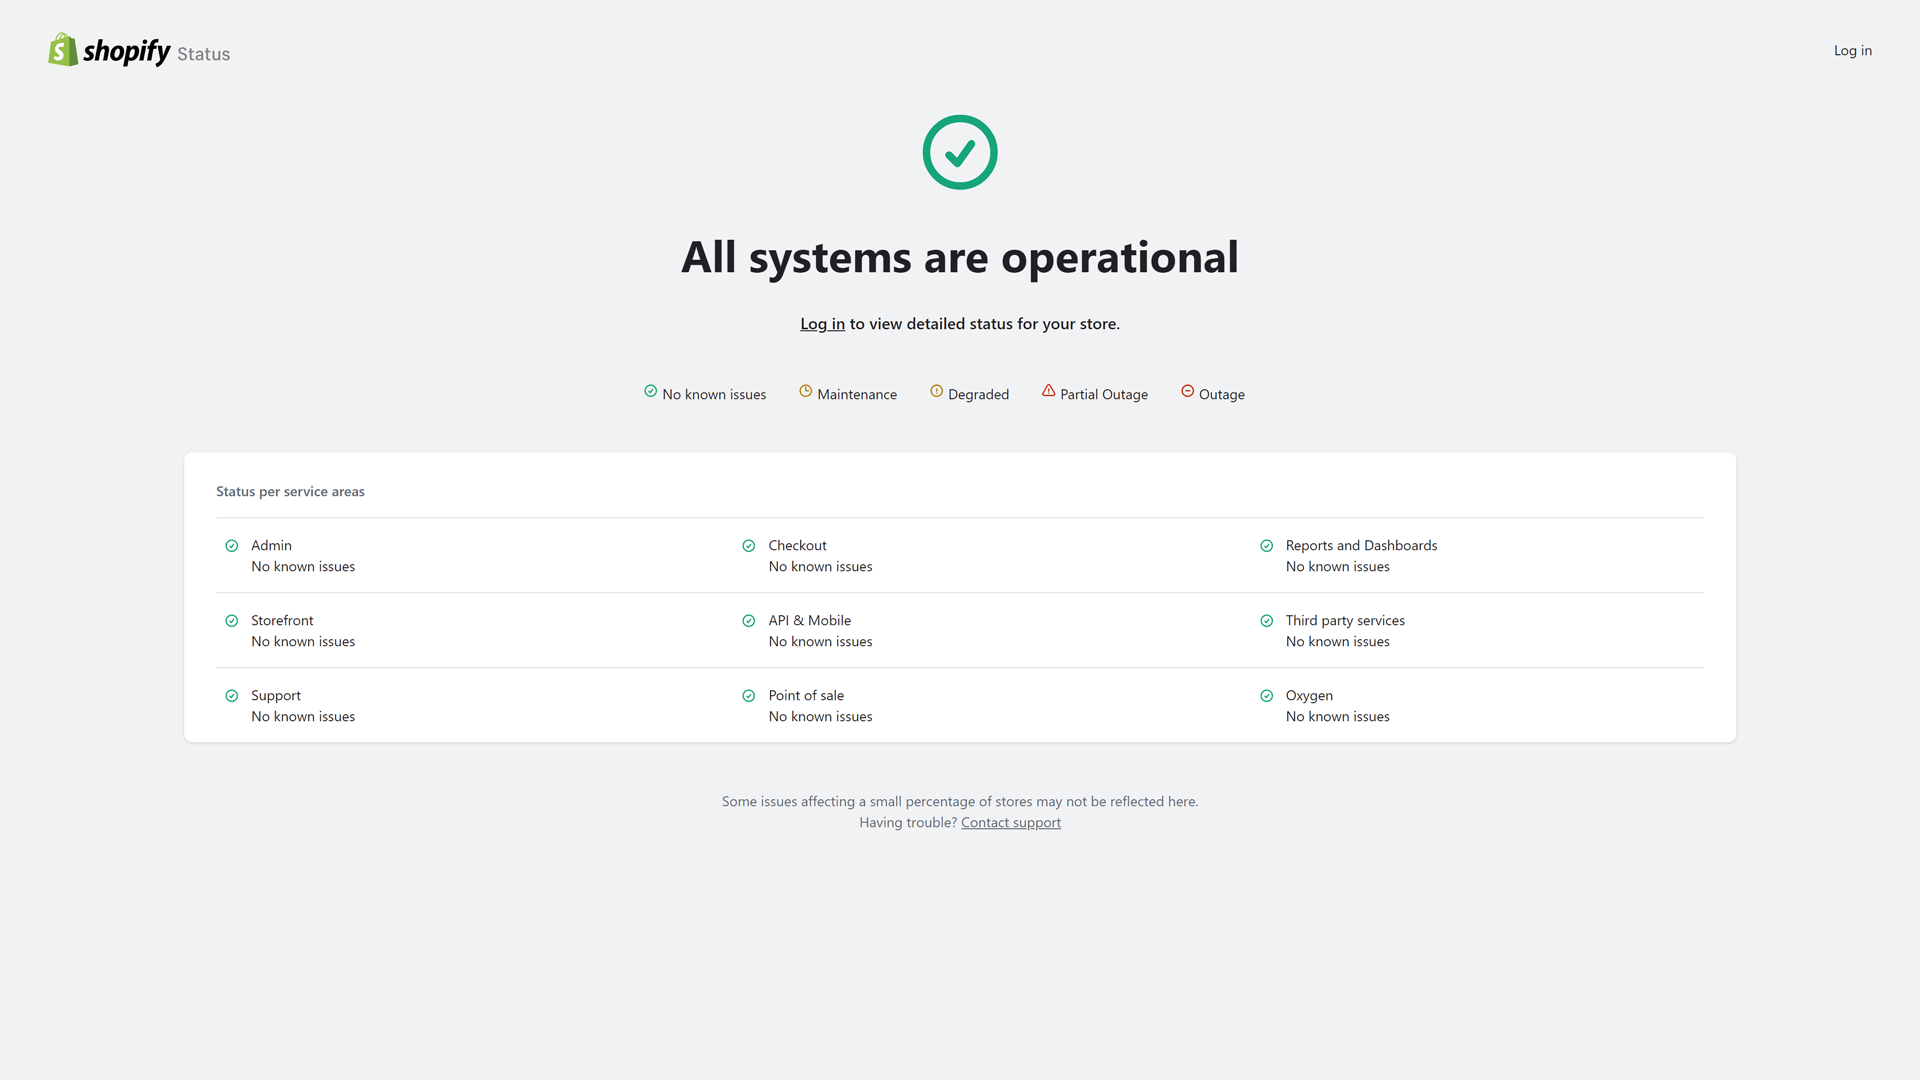
What They Do: They are a leading e-commerce website that helps users, particularly first-time sellers, to promote and sell products online securely. The service is popular with small businesses or individuals for growing and scaling their businesses.
What’s Great About Their Status Page? Their status page is basic and gets straight to the point. It immediately displays the overall operational status of Shopify and has service statuses underneath.
Additionally, like some other status page examples in this list, it offers a clear color code to separate incidents and categorize them.
There is also an option to view previous events. However, this is not a full incident history, which Shopify seems to be lacking. There were no events shown when the recent events link was clicked. It could be an aspect for improvement and help with transparency. Another point of interest is that there is a comment at the bottom of the page stating the following:
“Some issues affecting a small number of stores may not be reflected here.”
From this, we can infer that not all incidents are recorded. We don’t know this for sure. If there was an issue with a user’s store, there is a chance they would go to this status page and not find any information. It would help with Shopify’s transparency to resolve this issue.
Conclusion
The best status page examples above are varied and all have different attributes depending on the industry. There are no identical status page examples, but we defined features that make a good one.
Whatever elements you wish to add to your status page, it helps when it can be done easily. Some status page providers can only offer certain elements or features, so consider what you want your status page to look like first before subscribing to any plans. To play it safe, consider providers such as StatusGator. Tools like StatusGator have all the tools you need to create a user-friendly, clean status page with all your dependencies in one place.
FAQ on Status Page Examples
What makes a good, real-world status page?
There are many elements of a good status page. First and foremost, the key thing is you provide relevant and detailed information regarding the status of your services. A good status page breaks down all the relevant components of your services and displays both their current status and status history. That way, you have transparency between you and your users.
Secondly, a good status page is organized, easy to read, and easy to navigate. If not, it can make it inconvenient for users to try and find out what their issue is. It helps if the page is eye-catching without being overbearing, possibly by including banners or images that are spatially effective and not too large.
What is the importance of a status page?
A status page’s main purpose is for transparency between your services and your users. If an issue occurs, a status page provides your users with information to understand the issue quickly. Without one, they are left in the dark, and as a result, can lose trust in you over time.
How do I create a status page for my website?
If you want to create a website status page, you need to go to a status page provider. The most common providers in our list are StatusGator and Atlassian. StatusGator allows you to aggregate your services (and third-party services) into one place. It also contains many customizable features that you can use to tailor your status page to your website’s identity.
What should a status page include?
By looking at the examples above, we can understand what makes a good status page. Here are some of our suggestions:
- A clear, obvious section displaying the current status for all your key services – this should be at the top of the page and have a clear color code (green=operational, yellow=incident, red=outage, etc.).
- Incident history – a good incident history displays detailed status updates for past events. A color code also helps users understand incidents better.
- An option to subscribe to future updates
- A filter to narrow down search options, either for services or incident history
- A color scheme or page layout that matches your brand without being overbearing (a simple logo will do).
What are the different types of Statuspage pages?
Typically, there are three types of status pages you could have:
- Public status pages – for communicating with external customers
- Private status pages – for internal communication, usually with employees, stakeholders, and developers
- Audience-specific status pages – for pre-specified users and groups
Whatever status page you need, you can usually subscribe to specific plans for that particular page. For example, Atlassian status pages come in three different plans for the types listed above.
However, other status page providers can offer you a choice between status pages as part of one plan. For example, StatusGator has a one-plan-for-all-style plan, meaning you can keep track of all your status pages in one place.
What does a status page do?
A status page keeps your users and customers informed of any downtime or issues with your website or platform. Instead of them being kept in the dark when they are having IT issues, your status page can inform them quickly and efficiently. A status page typically displays the current status, and historical data, for key systems or services your website has.
What does a status page include?
Every status page example we have looked at shares similarities and differences. However, there are a few key features that almost every status page has:
- Incident History
- Current statuses of all key services
- A subscribe to updates button
- Status updates with detailed accounts of incidents, whether historical or ongoing.