When it comes to the best cloud monitoring tools, there are various services you can rely on or choose to support your IT infrastructure. After all, cloud monitoring is critical to ensure the performance, uptime, and overall health of cloud services.
Numerous teams in modern IT, SaaS, and app development companies, including DevOps, SREs, and security analysts depend on cloud monitoring solutions.
To help you make the right choice, here’s a list of the top cloud monitoring solutions widely used in the industry in 2025.
- Datadog
- New Relic
- Dynatrace
- SolarWinds
- Nagios
- LogicMonitor
- Splunk
- DigitalOcean
- PagerDuty
- AppDynamics
- Zabbix
- Better Stack
- Logz.io
- Netdata Cloud
- SumoLogic
- Grafana
- Prometheus
- Amazon CloudWatch
- Google Cloud’s Operations Suite (Stackdriver)
- Microsoft Azure Monitor
StatusGator

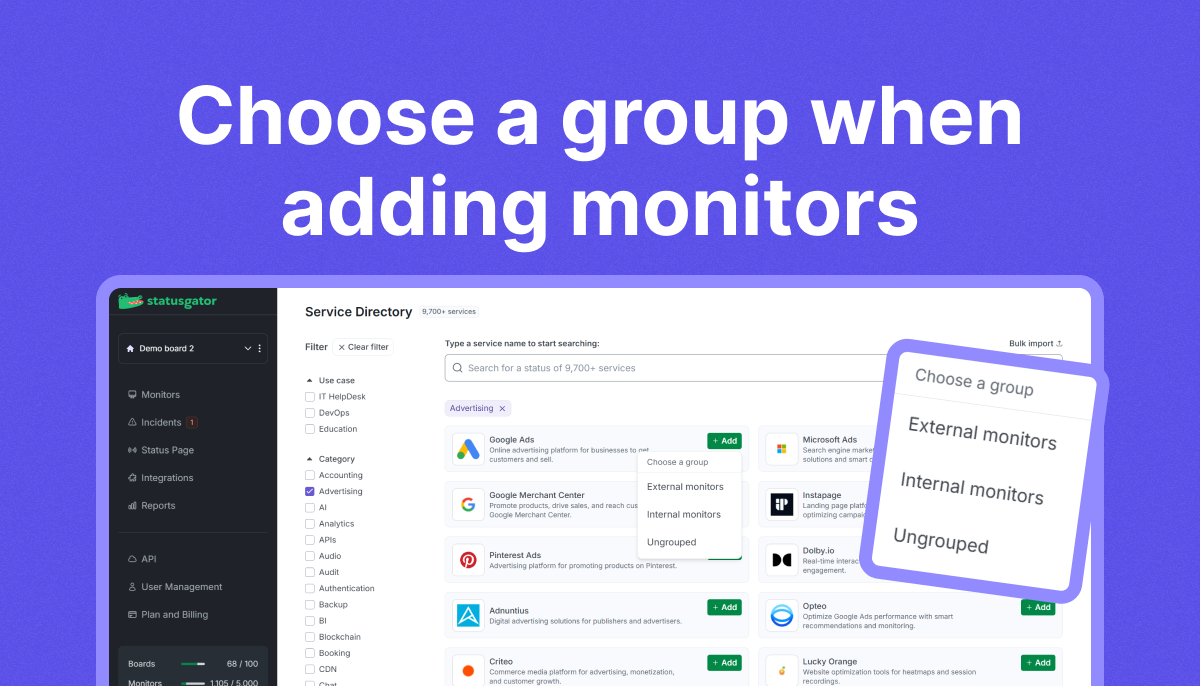
Before discussing the solutions on the list, we must mention StatusGator – a unique tool for cloud status monitoring.
StatusGator has been monitoring the cloud for more than 8 years. We collect the status of nearly 4,700 services from their official, published, status pages.
StatusGator monitors cloud services directly to understand the real-world impact of ongoing incidents. We use our worldwide detection system to find widespread outages and incidents before they are announced on vendor status pages, giving you early warning signals.

20 Best Cloud Monitoring Tools in 2025
Now that we’ve mentioned StatusGator, it’s time to jump into the 20 best cloud monitoring tools in 2025!
Datadog
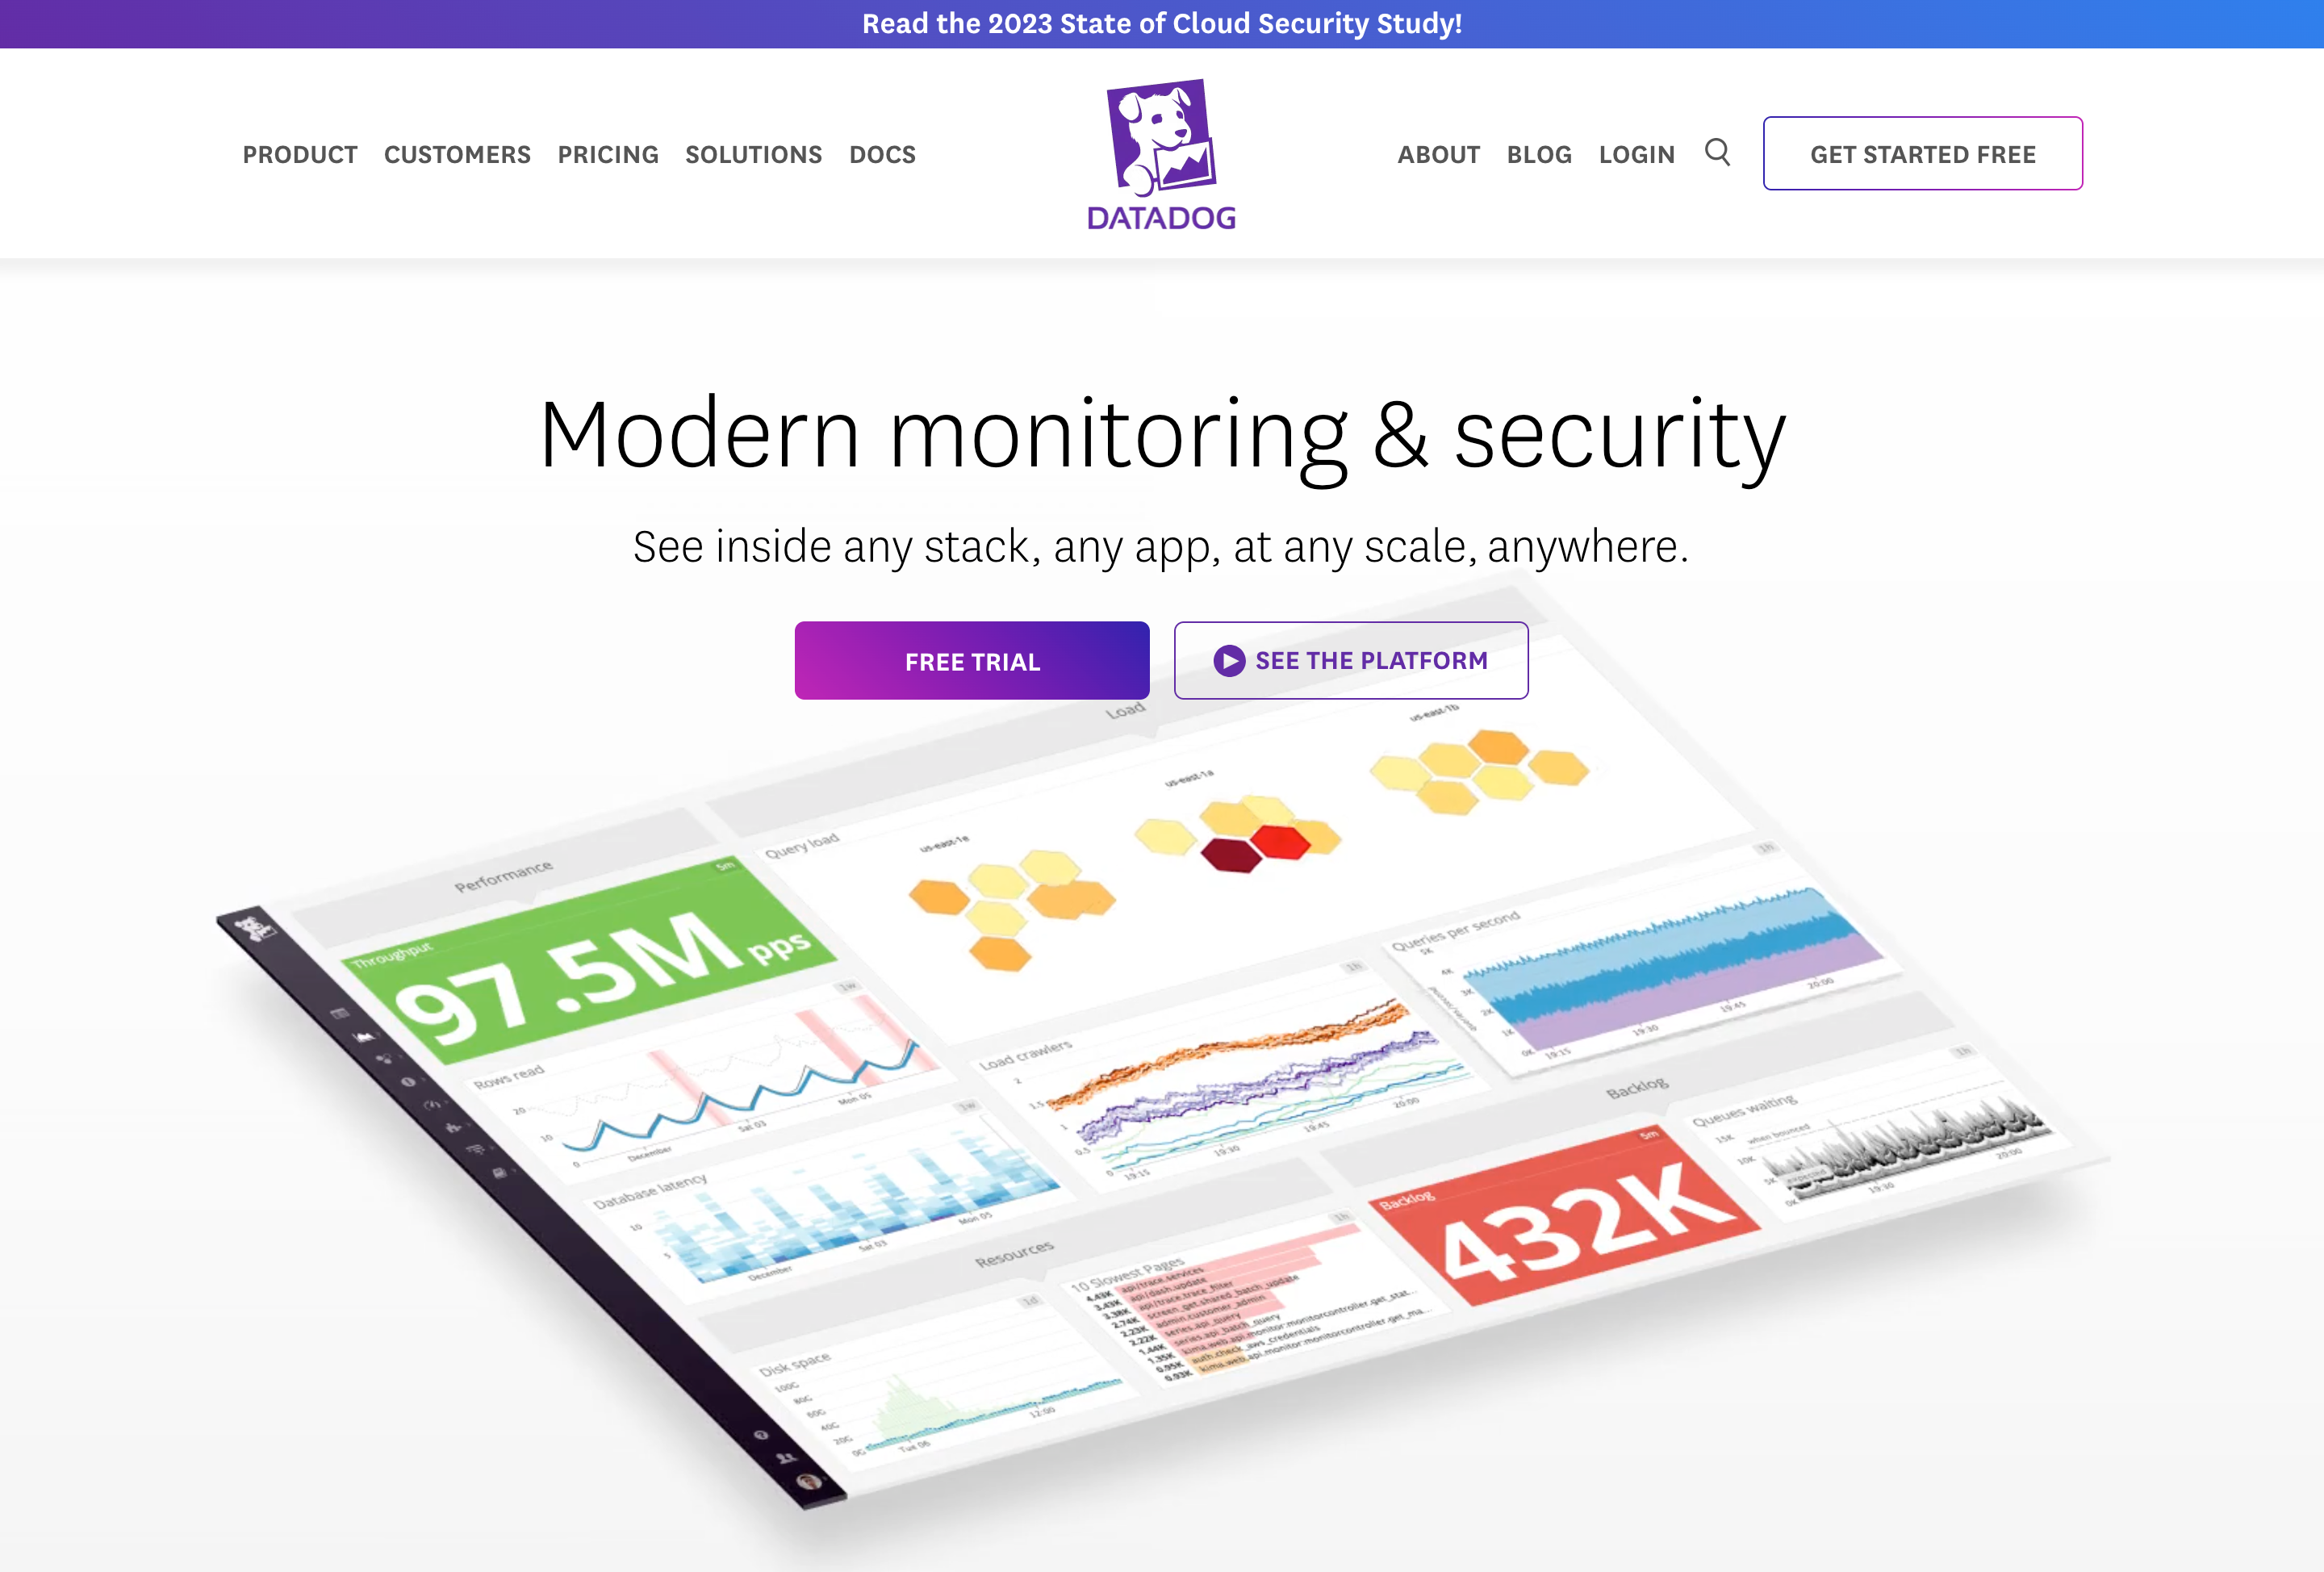
Datadog is a cloud monitoring tool featuring the observability of full-stack IT infrastructure. It excels in real-time monitoring, log management, and security insights, supporting various performance monitoring aspects such as application, service, continuous profiling, and database monitoring.
Datadog focuses on swiftly identifying and resolving issues, ensuring application reliability and comprehensive security. Additional features include workflow automation, anomaly detection, alerts, and incident management, supported by IDE plugins and a robust API. Datadog collects metrics from diverse sources such as cloud services, serverless functions, databases, etc.
Key Benefits and Features
- Deployment is straightforward and swift, eliminating the need for extensive training.
- Accessible tool for teams of all sizes.
- Datadog has add-ons for IoT applications and supports over 450 integrations.
- Simplified data analysis and visualization as all metrics are aggregated in a unified, easily customizable dashboard, which can be tailored using intuitive drag-and-drop features. Users can also access custom metrics in higher-tier plans.
Pricing
The free Datadog plan offers unlimited user accounts and retains full-resolution data for one day. However, it does not include features like alerting or container monitoring. For more advanced capabilities, the initial monitoring package costs $20 per month per host.
New Relic
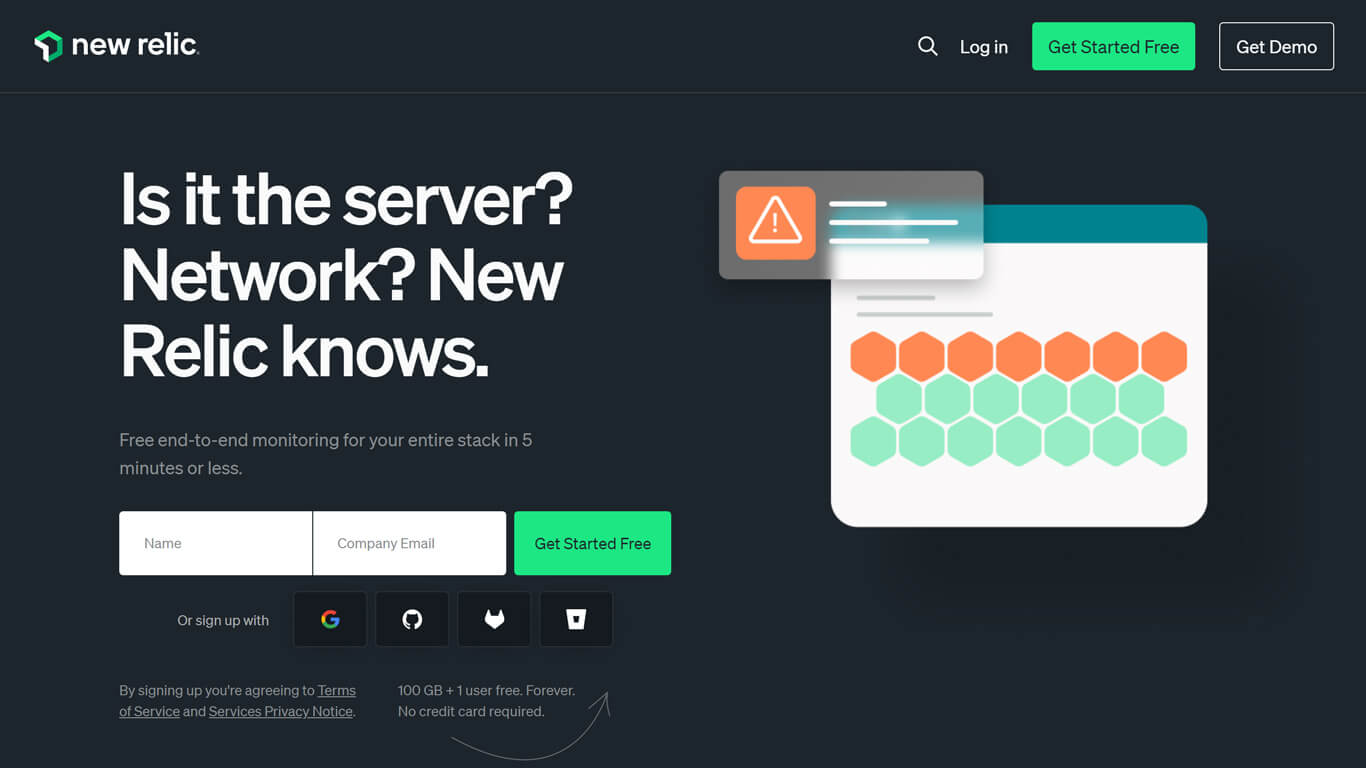
New Relic delivers full-stack observability and advanced analytics for cloud environments, monitoring applications, real user experiences, infrastructure, and network performance.
New Relic focuses on comprehensive network performance analysis, anomaly detection, distributed tracing, synthetics monitoring, and serverless function monitoring. It does this by leveraging AI for actionable insights, real-time data consolidation, automatic Kubernetes instrumentation, and log management.
New Relic reduces resolution time and enhances user experience, easily gaining a spot on our list of best cloud monitoring tools.
Key Benefits and Features
- This tool is notable for its adaptability, offering real-time access to precise and customizable metrics regardless of whether the environment spans single or multiple clouds or operates on-premise.
- The platform offers a broad and flexible integration network, supporting widely used integrations, including AWS, Azure, Google Cloud Platform, MySQL, NGINX, and Kafka.
- For any unsupported integrations, New Relic provides the Flex integration builder.
Pricing
Prices start at $0.30 per GB. New Relic’s free plan includes basic log management and analysis features, with additional packages priced based on usage, allowing users to pay for only what they need beyond the free plan.
Dynatrace
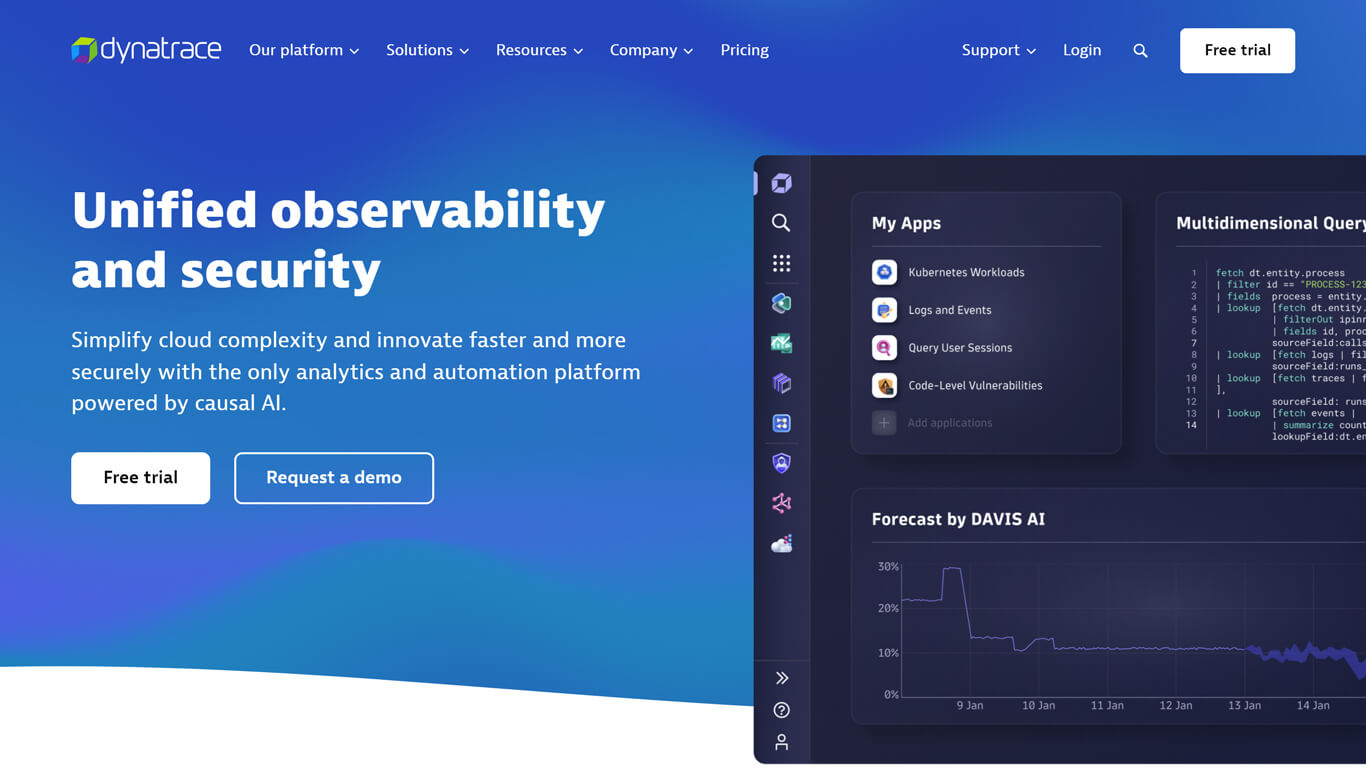
Dynatrace, an AI-powered, full-stack performance management solution, is renowned for its advanced observability in application performance, infrastructure, and cloud environments.
Key features include comprehensive cloud infrastructure health monitoring, auto-detection, and monitoring of components across various cloud environments.
The tool also offers real-time dependency mapping. Users get to work with detailed monitoring of virtualized environments and in-depth observability of containers, aiding in distributed application monitoring.
Additionally, Dynatrace supports transaction tracing for capacity management and cost optimization in cloud applications.
Key Benefits and Features
- Dynatrace employs advanced artificial intelligence to provide deep insights across the entire stack, from applications and services to infrastructure and networks. Its AI capabilities automatically detect and diagnose issues, reducing resolution time.
- Dynatrace offers extensive integration with major cloud platforms like AWS, Azure, and GCP and monitors various dynamic cloud environments. This includes containerized environments and microservices.
- Dynatrace provides real-time, automatic mapping of application and infrastructure dependencies, aiding in complex cloud architecture management.
- The Dynatrace Developer Program provides lifelong free access to a developer instance on the Dynatrace platform, fostering innovation and extension across hybrid cloud ecosystems with training and best practices for developers.
Pricing
The Dynatrace free plan primarily offers a 15-day trial with no credit card required. This trial can be explored in the user’s environment or using sample data. However, for more comprehensive details regarding the exact features and limitations of the free plan, further information from Dynatrace’s official resources would be required.
SolarWinds
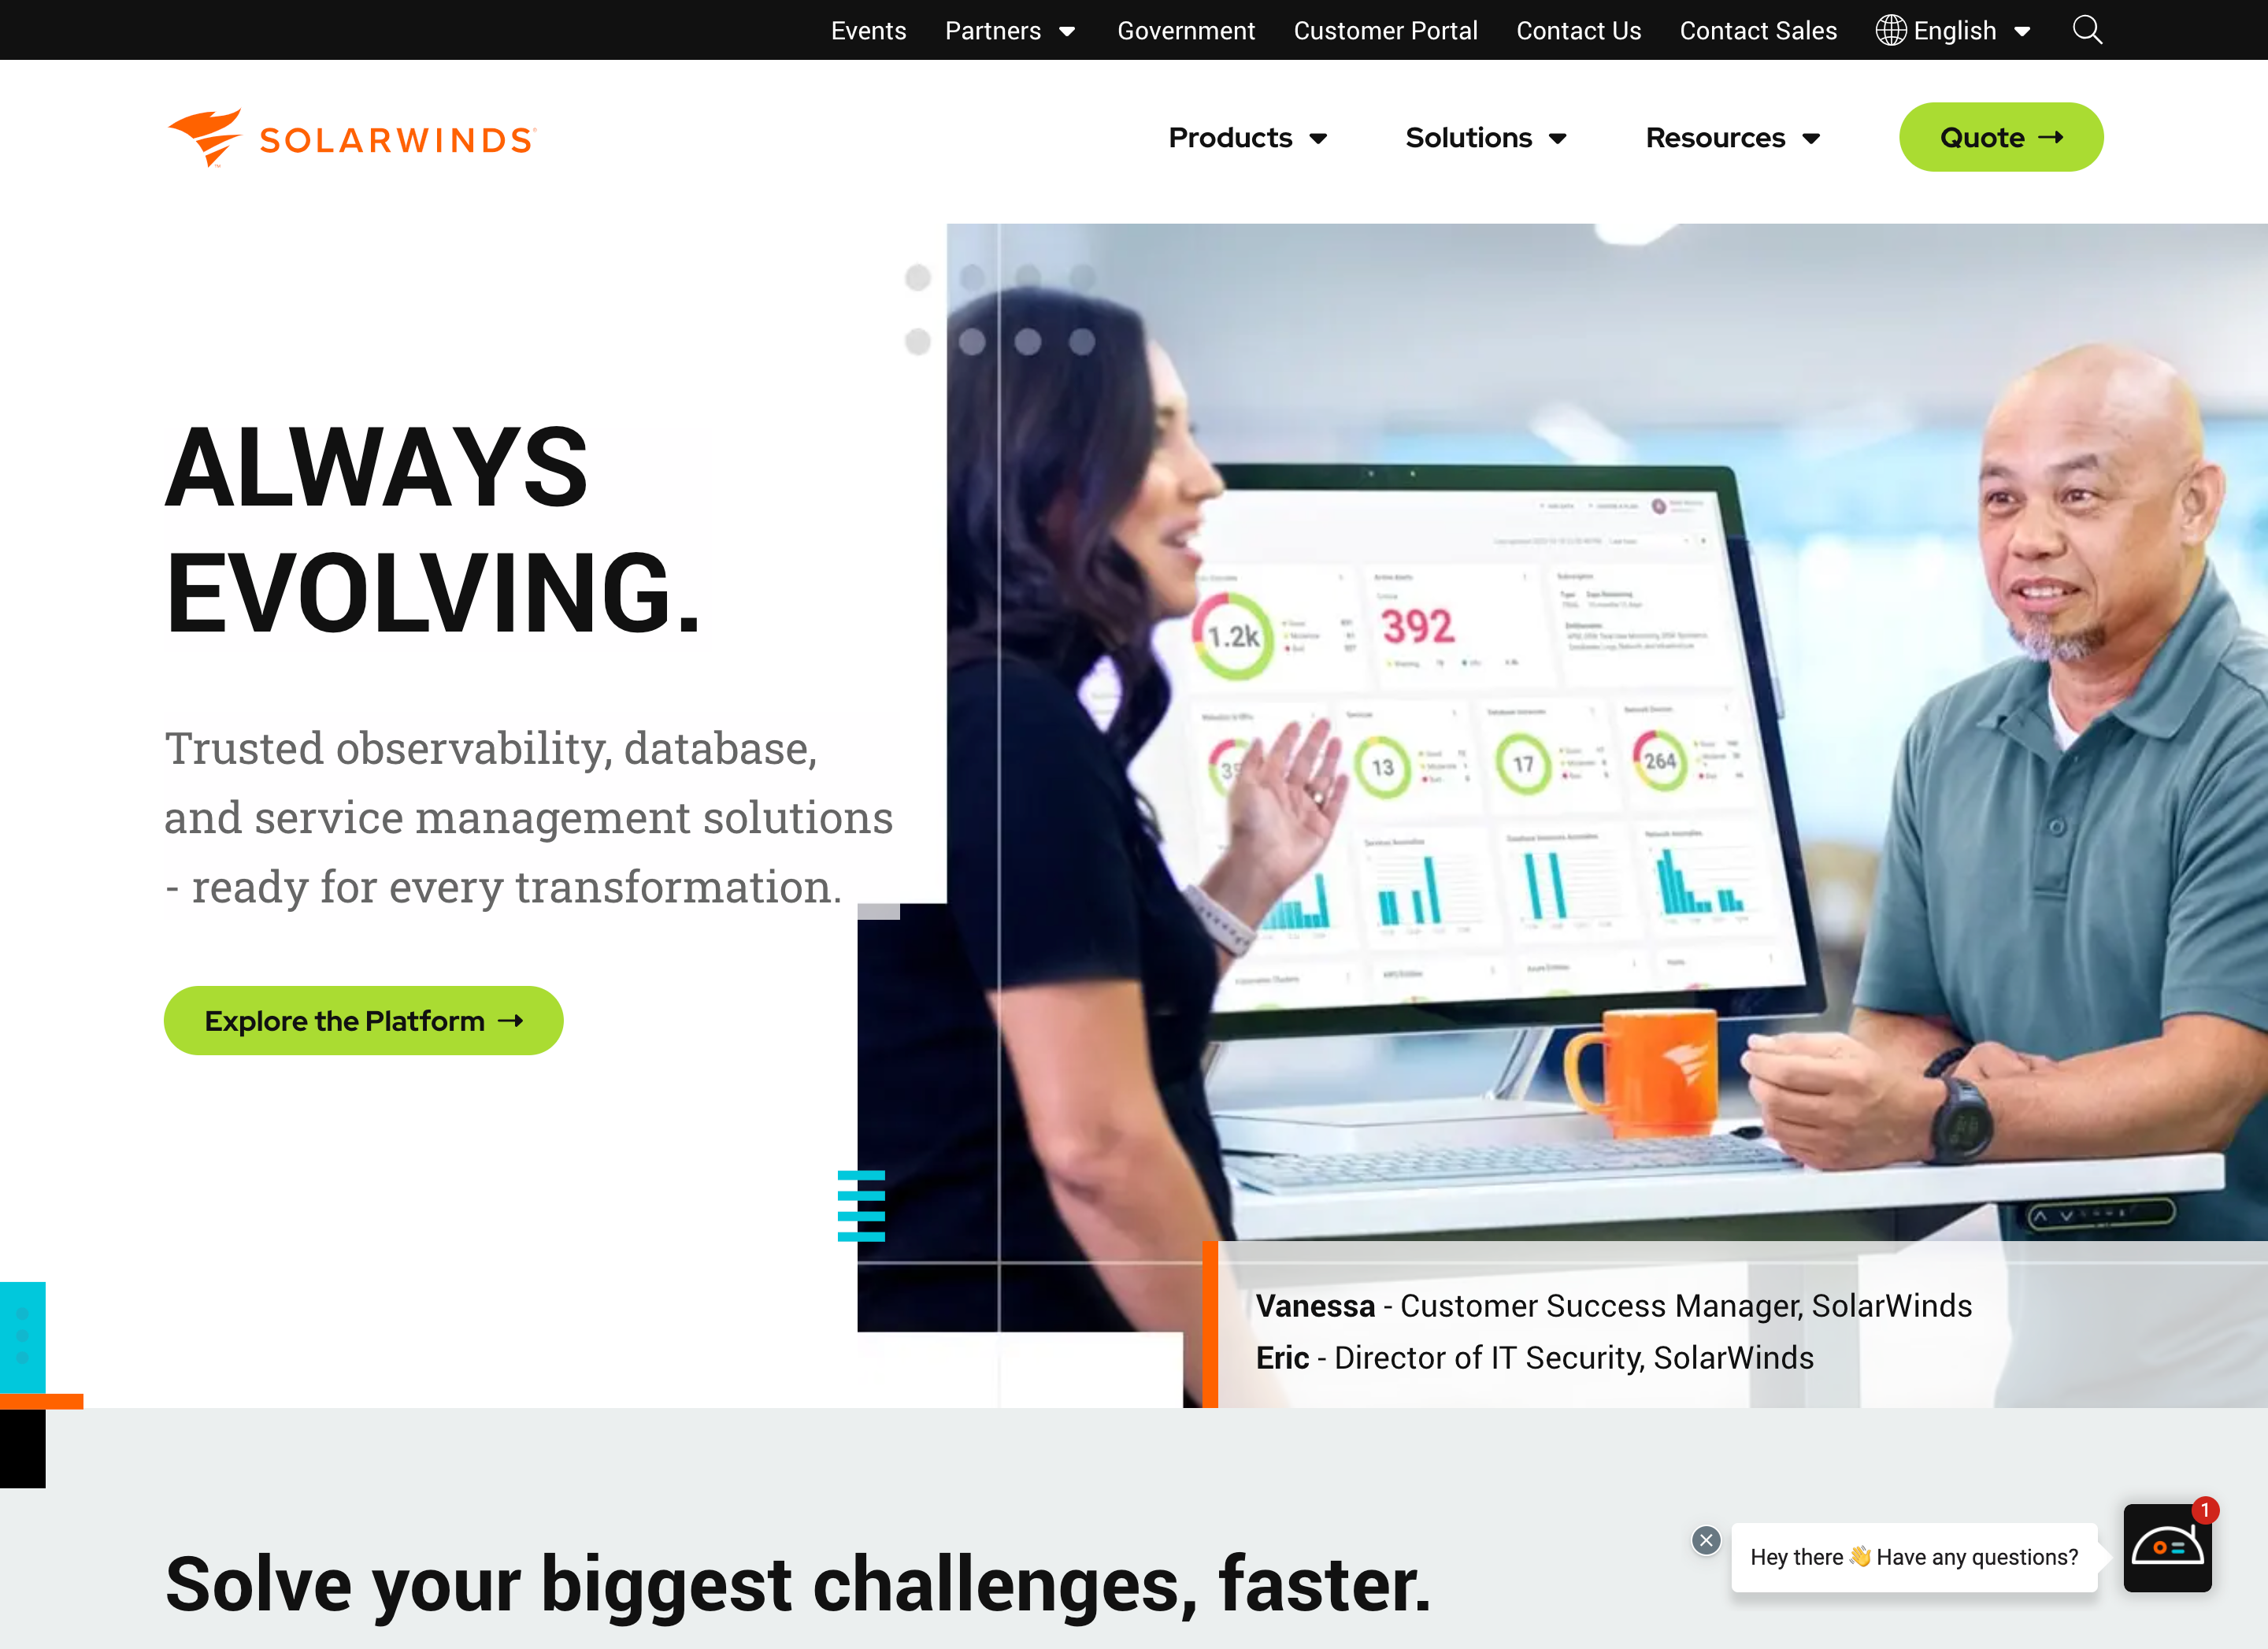
SolarWinds offers diverse tools, including cloud monitoring solutions for observing, managing expenses, and ensuring compliance. SolarWinds Hybrid Cloud Observability is a noteworthy feature that ensures availability and reduces remediation time across on-premises and multi-cloud environments.
It features unified observability, integrated coverage, and AI for IT operations (AIOps), detecting anomalies and providing actionable insights. SolarWinds supports various teams with flexible deployment options and user-friendly interfaces, enhancing service levels, empowering teams, and facilitating cloud modernization efforts.
Key Benefits and Features
- SolarWinds offers 1200+ integrations for performance monitoring.
- Its Server and Application Monitor (SAM) consolidates various monitoring solutions into a single platform.
- SAM with hundreds of ready-to-use templates.
- Real-time and historical data insights into server applications and performance.
- Capacity planning, custom application monitoring, and application dependency mapping.
Pricing
Starting at $1,830, SAM offers subscription and perpetual licensing options. There is a free trial and an interactive demo, and users can request a free quote for pricing.
Nagios
Nagios XI, an open-source tool, delivers enterprise-level monitoring and alerting for servers, network hardware, applications, and services. The efficient Nagios Core 4 engine ensures robust server performance.
Known for its customizable GUI and advanced features like user management, multi-tenancy, and proactive alerts, Nagios XI stands out as a comprehensive cloud monitoring solution with configuration wizards for easy setup.
Key Benefits and Features
- Nagios stands out with support for a wide array of proprietary and third-party add-ons, ensuring comprehensive coverage of IT components.
- The highly customizable graphical user interface (GUI) enhances usability, allowing tailoring to individual user preferences.
- Nagios employs the Nagios Core 4 monitoring engine, providing efficient and scalable monitoring suitable for diverse IT environments.
Pricing
Nagios prices start at $1,995 for a 100-node license for Nagios XI. Nagios Core is the free and open-source version of Nagios XI, providing basic monitoring and customization.
Nagios Core does not include the advanced features of Nagios XI.
LogicMonitor
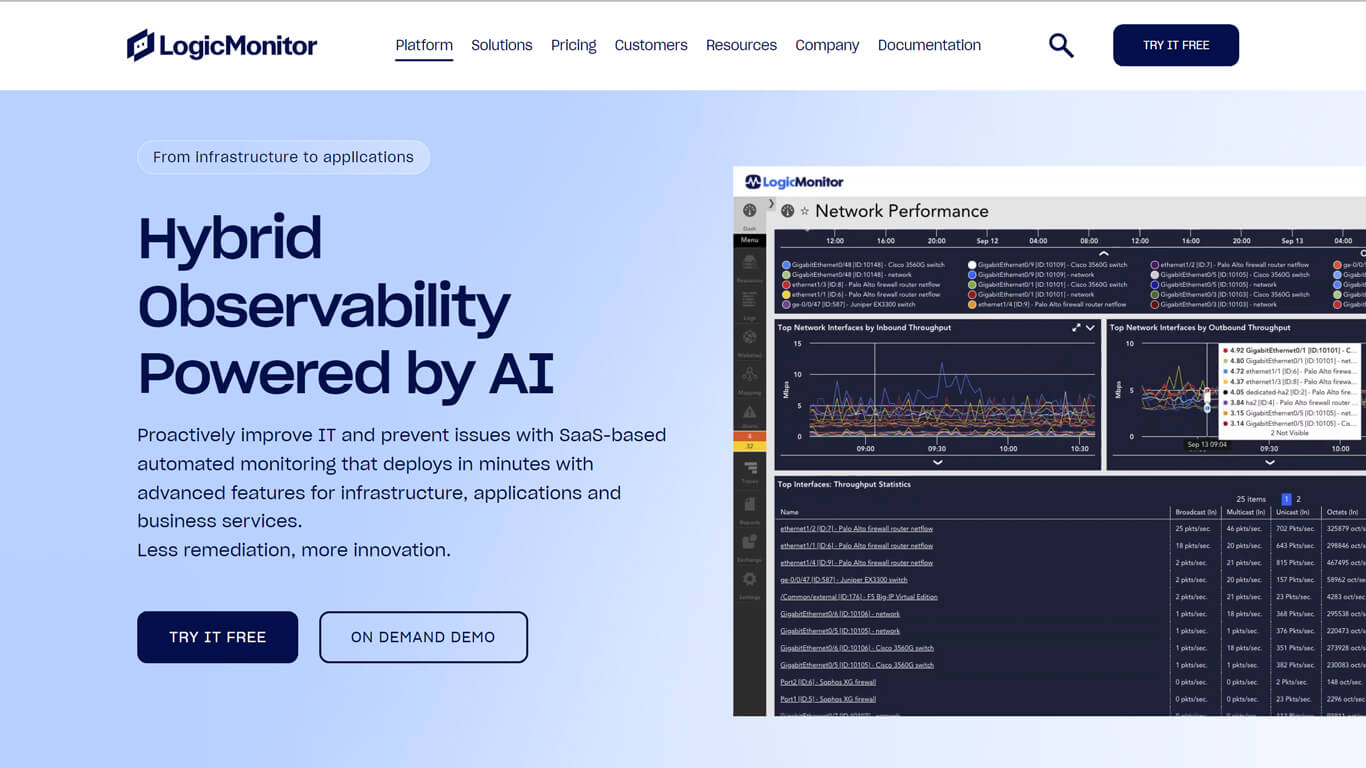
LogicMonitor is a fully automated cloud-based infrastructure monitoring platform with extensive capabilities for monitoring cloud services, networks, servers, and storage systems.
The platform supports over 70 AWS services and critical Azure-hosted services. Splunk also automatically discovers and monitors Google Cloud Platform services. With features like agentless resource discovery, dynamic alerting, cost prediction, and integration with various tools, LogicMonitor is a versatile solution for monitoring SaaS applications and complex cloud environments.
Key Benefits and Features
- LogicMonitor supports many integrations and provides unified monitoring for AWS, Azure, GCP, and on-premises infrastructure, ensuring extensive coverage.
- Includes agentless resource discovery, dynamic alerting based on AI-driven insights, and the ability to efficiently predict and manage cloud costs.
- Integrations with various service management and communication tools.
Pricing
Prices are available upon quotes. LogicMonitor has a free trial that allows potential users to explore the platform’s features. This trial typically includes access to LogicMonitor’s monitoring capabilities, giving users a comprehensive view of its functionality.
Splunk
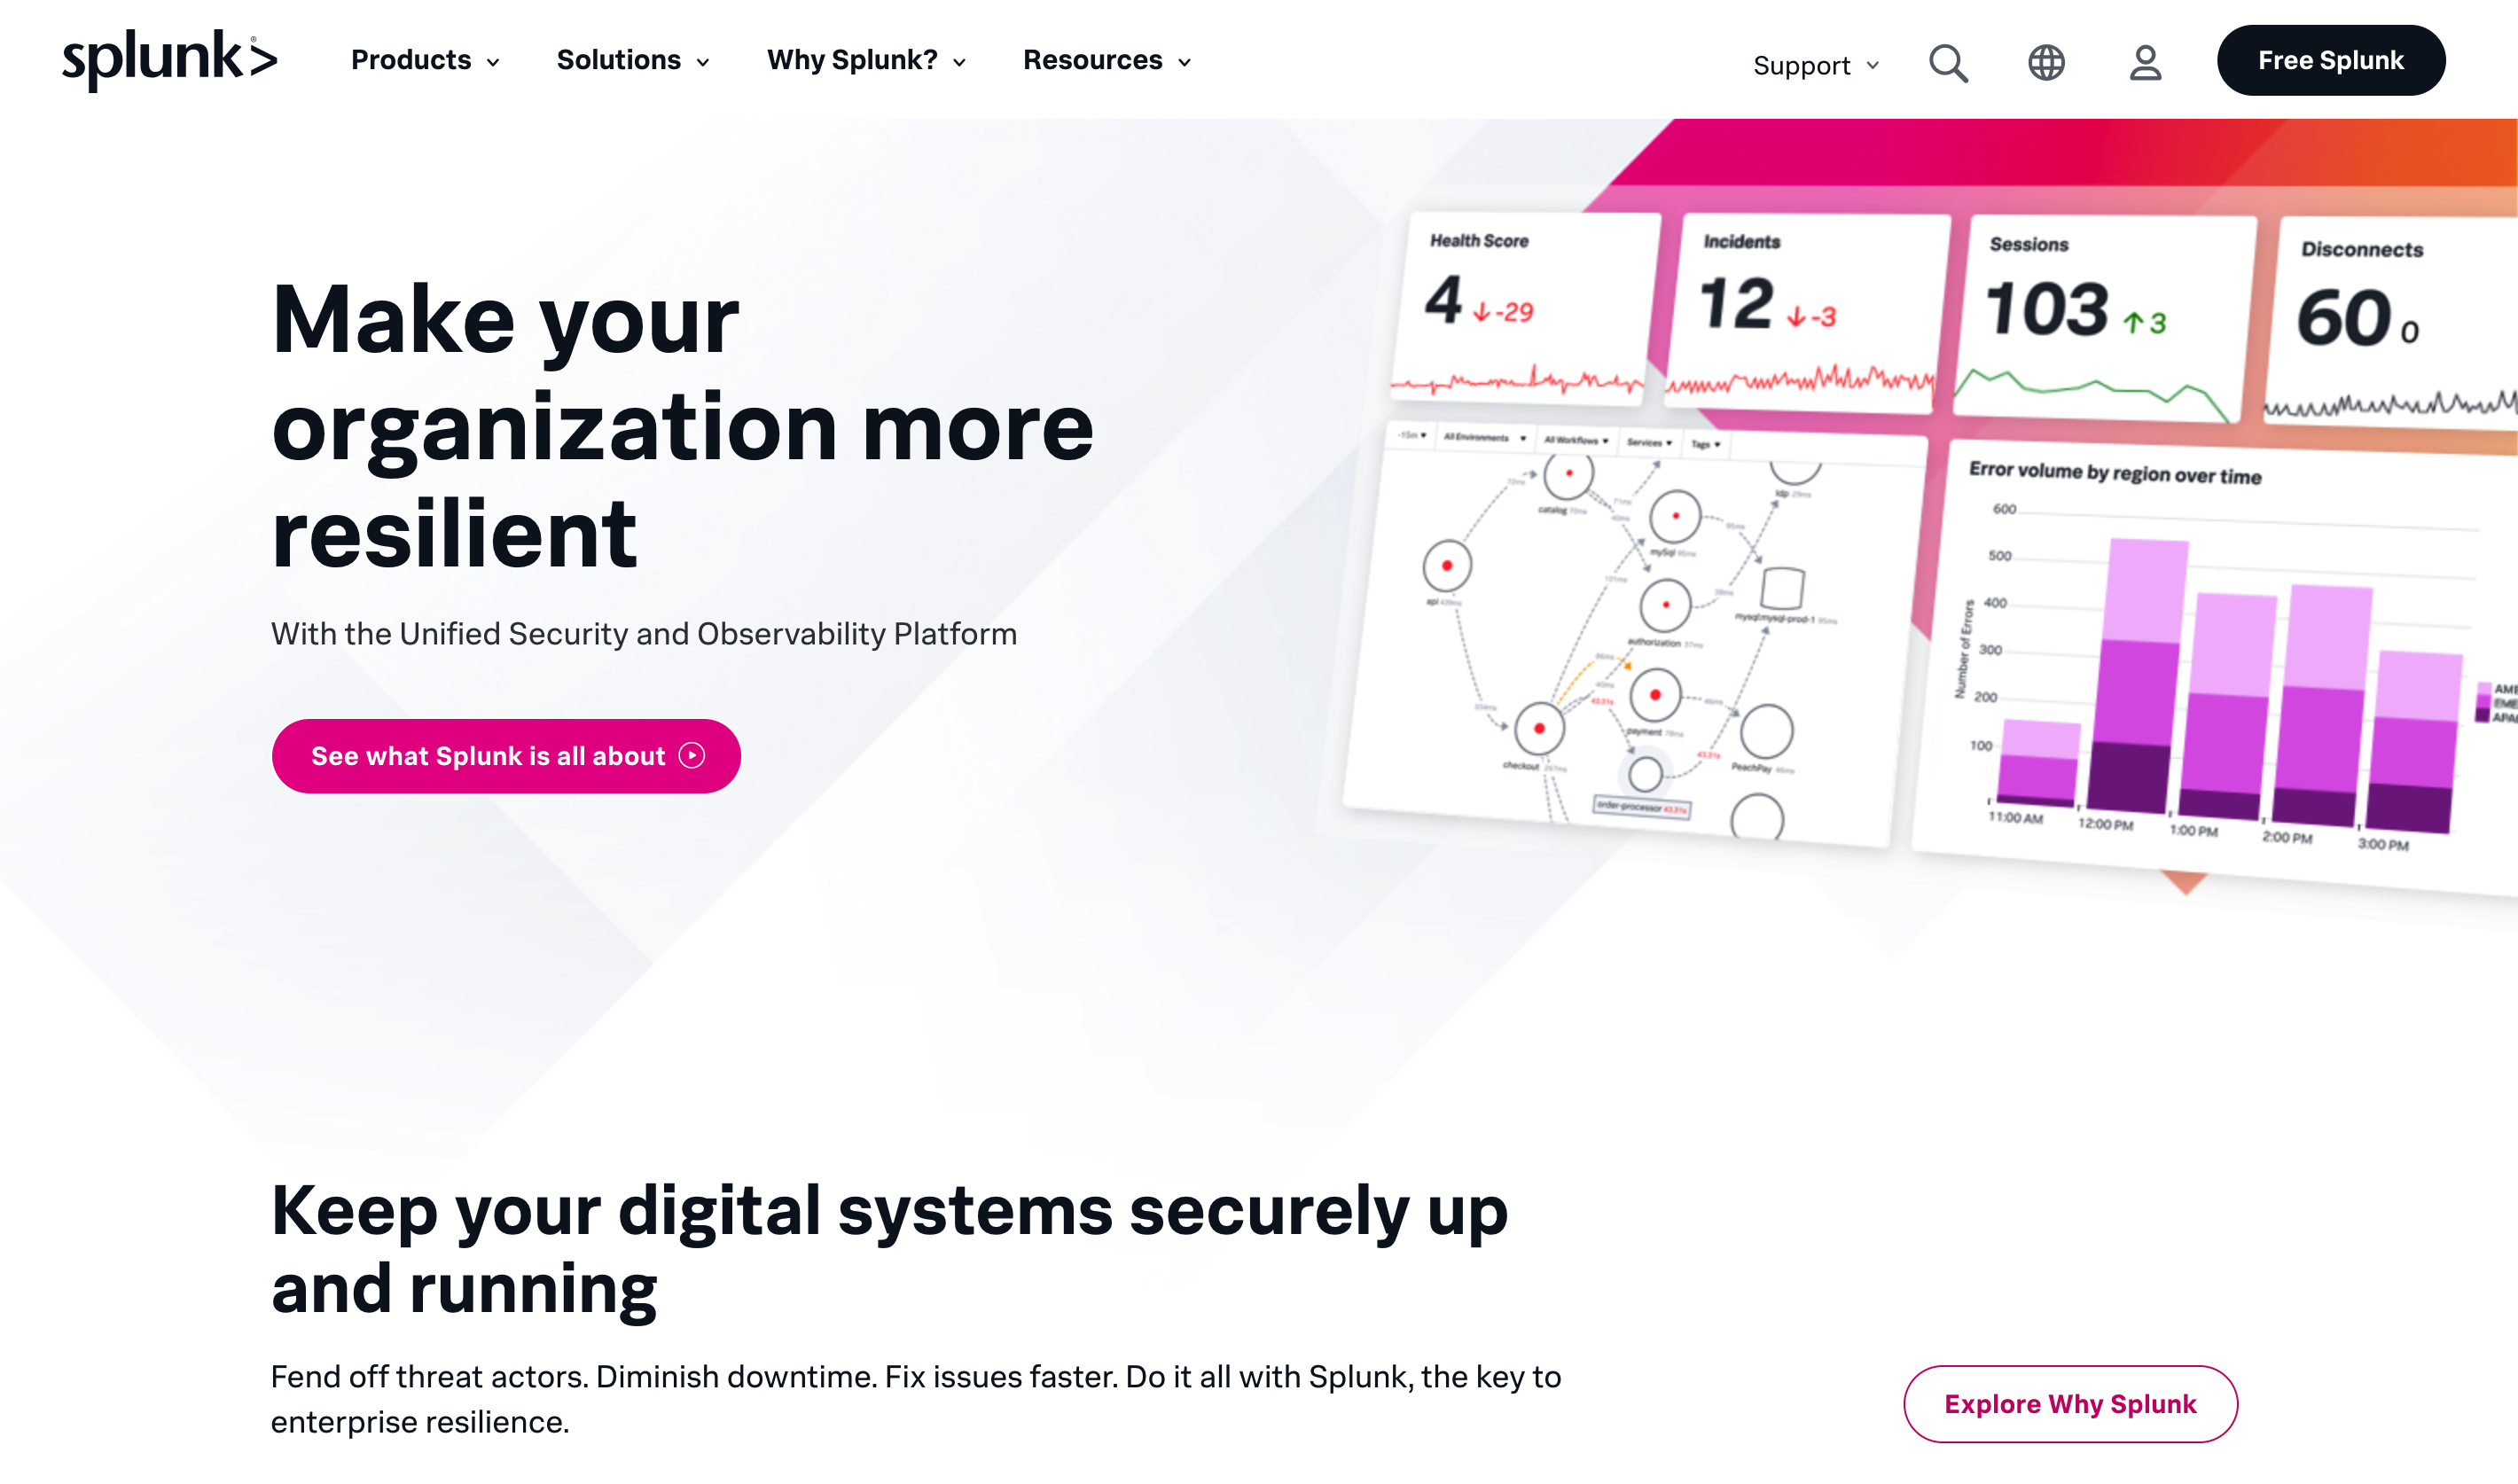
The cloud monitoring tool is known for its robust data processing capabilities. Splunk focuses on operational intelligence, particularly monitoring and analyzing machine-generated big data in the cloud.
Tailored for DevOps and cloud engineering teams, Splunk’s features include Log Observer Connect for rapid debugging in cloud-native environments.
The platform simplifies data management, offering onboarding from diverse sources, centralized control, and customizable dashboards. Continuous monitoring of events and KPIs, along with real-time custom alerts, is designed to enhance operational efficiency. This facilitates immediate responses to critical events in cloud environments.
Key Benefits and Features
- Splunk offers integration with a wide range of data sources.
- Advanced Log Management, continuous monitoring of critical KPIs, and real-time alerts help with immediate response to critical events.
- Customizable data visualization and alerts are designed to enhance user experience.
Pricing
Splunk Free provides limited access to Splunk Enterprise features for standalone installations, allowing indexing up to 500 MB of data daily. Exceeding this limit triggers three warnings before turning off search functionality while data indexing continues.
DigitalOcean
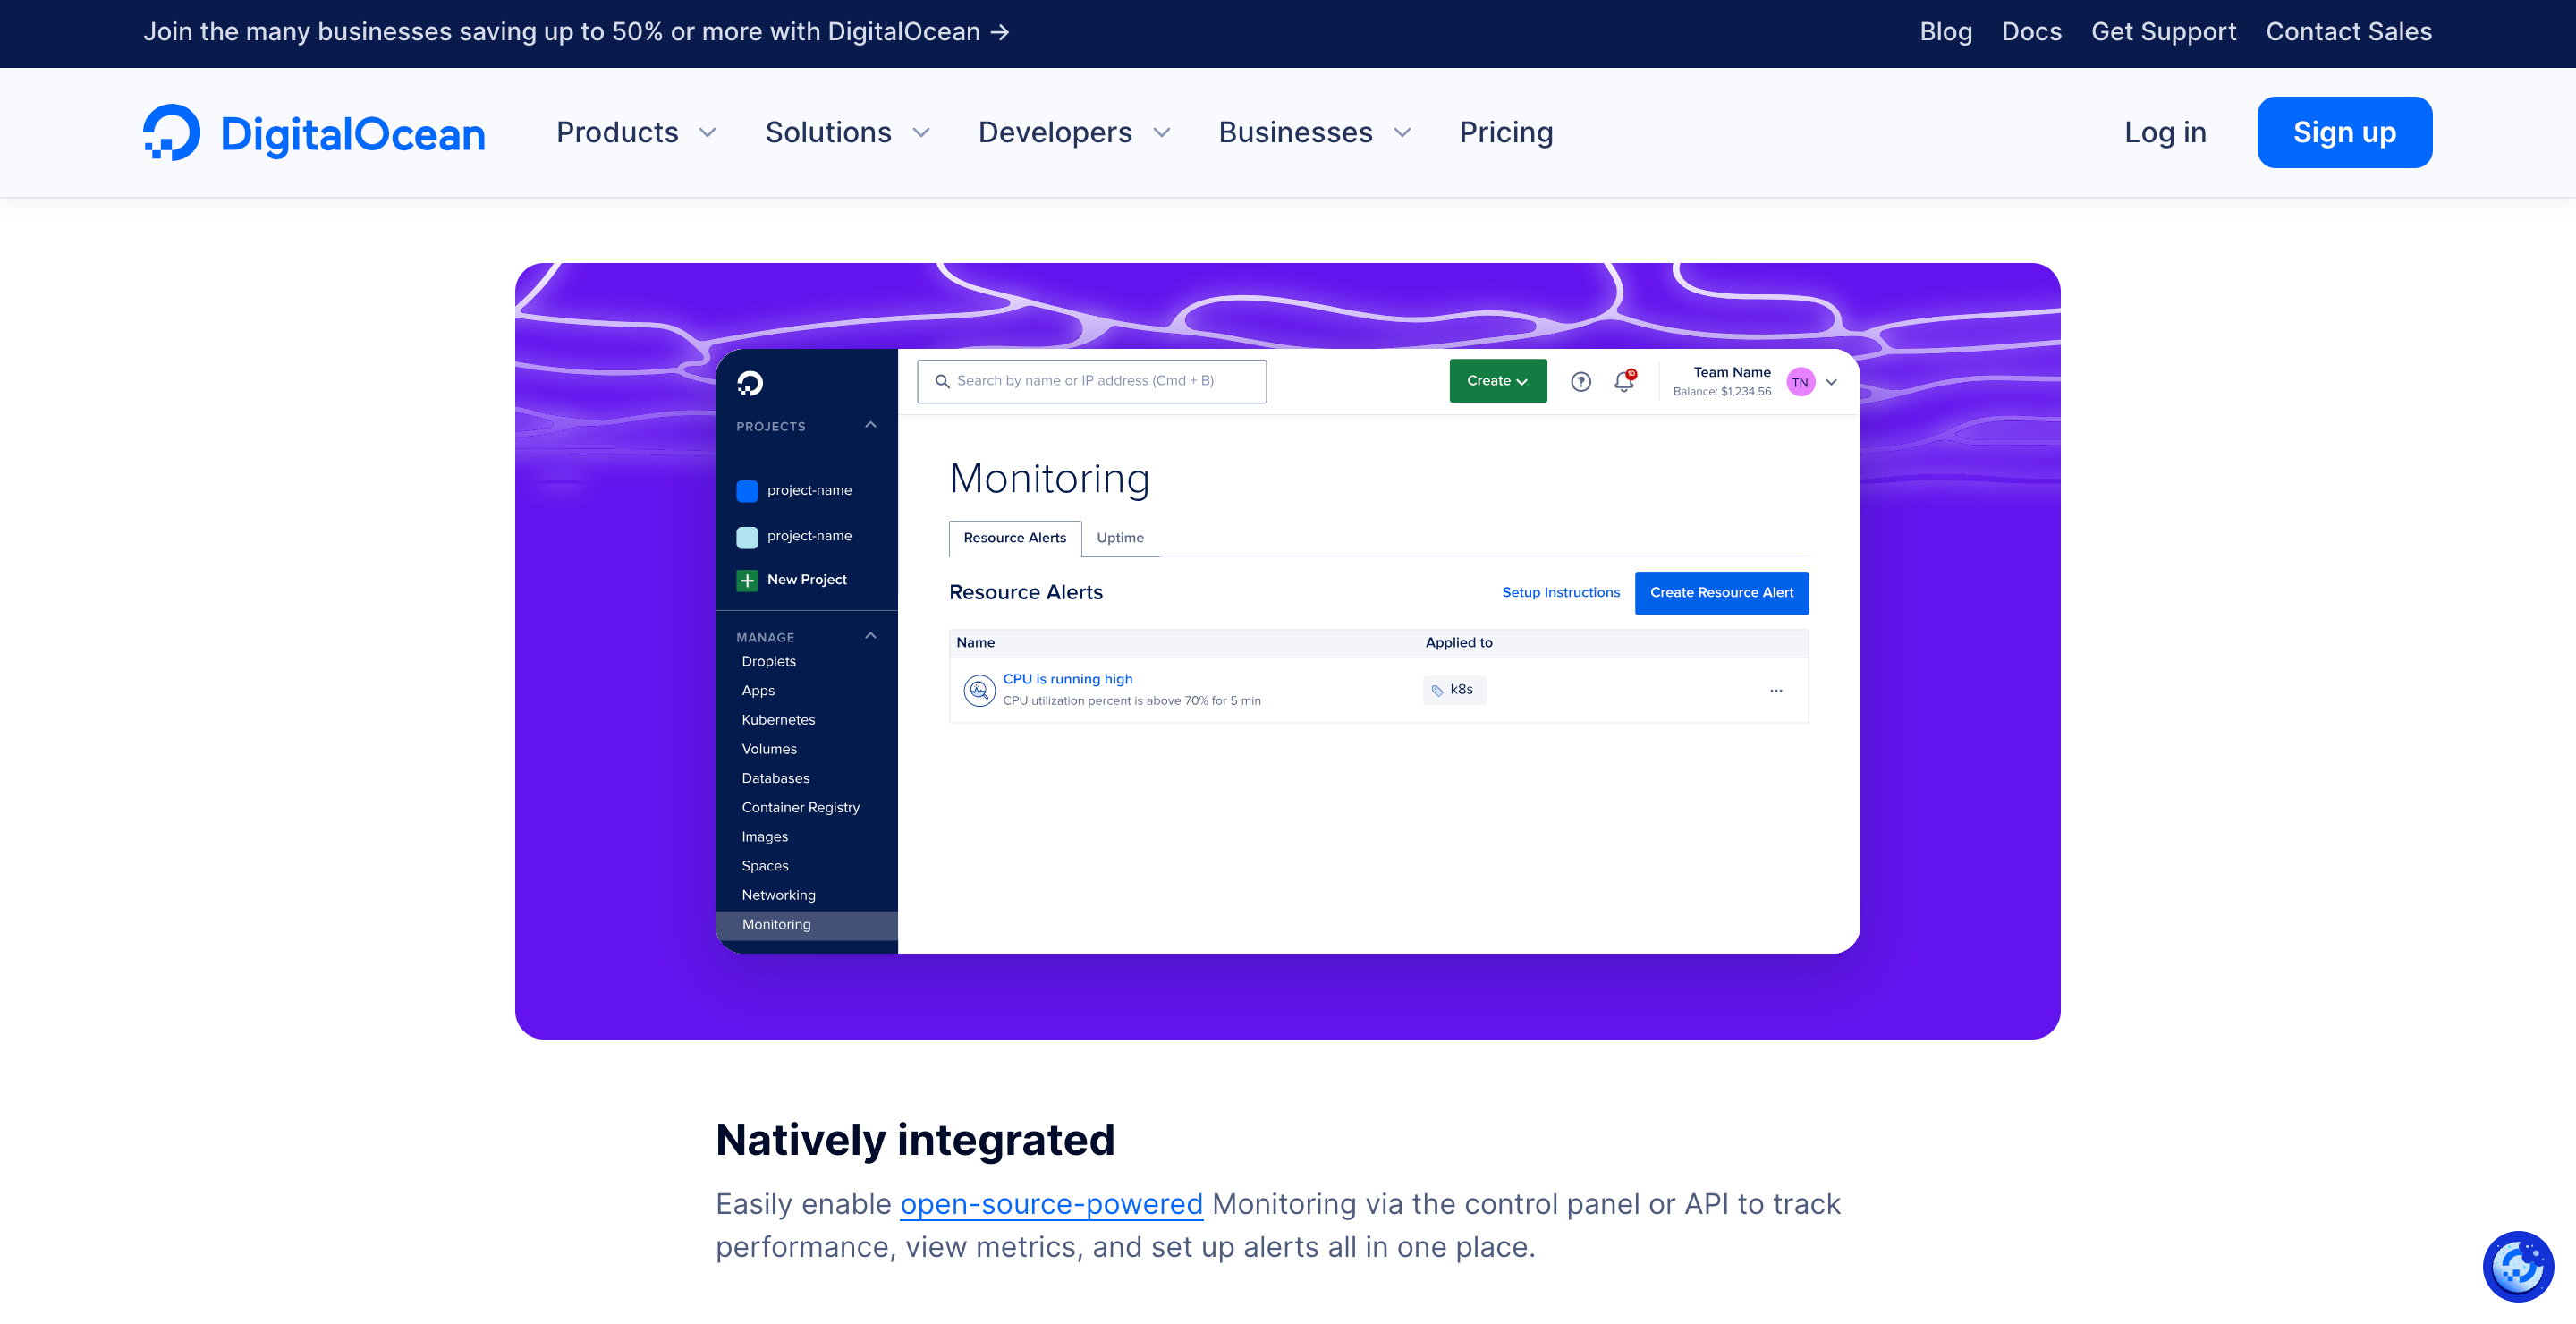
DigitalOcean monitoring is a free, opt-in service that offers comprehensive monitoring for Droplet-level resource utilization.
It features an open-source agent that gathers system-level metrics, enabling users to view graphs, track performance, and set up alerts within the control panel according to their requirements. This service can be enabled for new and existing Droplets (cloud virtual machines) through the control panel or API.
Key Benefits and Features
- Visualizes system-level metrics, including public/private bandwidth, CPU usage, and disk I/O, offering insights into resource trends.
- Enables rule creation to define resource consumption thresholds and trigger notifications (email or Slack) when exceeded.
- Supports metrics-based alerting for CPU, bandwidth, disk, and memory usage.
- Compatible with various operating systems, ensuring flexibility across environments.
- Community resources and extensive documentation are included for user support.
Pricing
DigitalOcean offers a $200 credit for a 60-day free trial, which requires a valid credit card.
PagerDuty
PagerDuty is an incident response platform for IT departments, priding itself on efficient on-call scheduling, automated escalations, and incident tracking. This solution emphasizes proactive, intelligent management of digital operations and customer service.
Beyond on-call management, it offers insights into business impact, supports coordinated responses, and integrates with various tools for real-time insights.
Key features include service and team organization, dynamic automation for issue resolution, and linking customer support cases to incidents.
Key Benefits and Features
- PagerDuty strongly emphasizes incident management and real-time operations, aiming to reduce incident frequency and duration while prioritizing customers.
- The platform seamlessly integrates with diverse tools, aggregating data into actionable insights within a digital ecosystem.
- Enhances overall efficiency using machine learning to reduce noise and provide context to the events.
- Includes automated routine operations, coordinating real-time stakeholder responses, and linking customer support directly to incident management.
Pricing
PagerDuty’s free plan offers several features suitable for a small team of up to five members, such as on-call scheduling and unlimited API calls. Still, users need the paid version for access to more features.
AppDynamics
AppDynamics specializes in application performance management, IT Operations, and analytics, emphasizing optimal performance and security in diverse cloud environments. It aligns technical performance metrics with business outcomes, aiming for a flawless user experience and offering Application Performance Monitoring (APM).
With support for on-premise, hybrid, and cloud-native environments, it isolates performance issues, monitors third-party networks, and provides automated, adaptive application security, making AppDynamics a versatile tool for comprehensive performance and security management in digital ecosystems.
Key Benefits and Features
- AppDynamics aligns IT performance metrics with business outcomes, allowing businesses to correlate IT infrastructure performance with overall success directly.
- With advanced Application Performance Monitoring (APM) capabilities, AppDynamics boasts a flawless user experience, prioritizing high-quality delivery.
- The platform monitors diverse environments, including on-premise, hybrid, and cloud-native systems. It stands out by isolating performance issues in third-party networks and automating adaptive application security.
Pricing
AppDynamics’ price starts at $6 per month. AppDynamics Lite offers a free, full-featured version of their Application Intelligence Platform, available for an unlimited time.
Zabbix
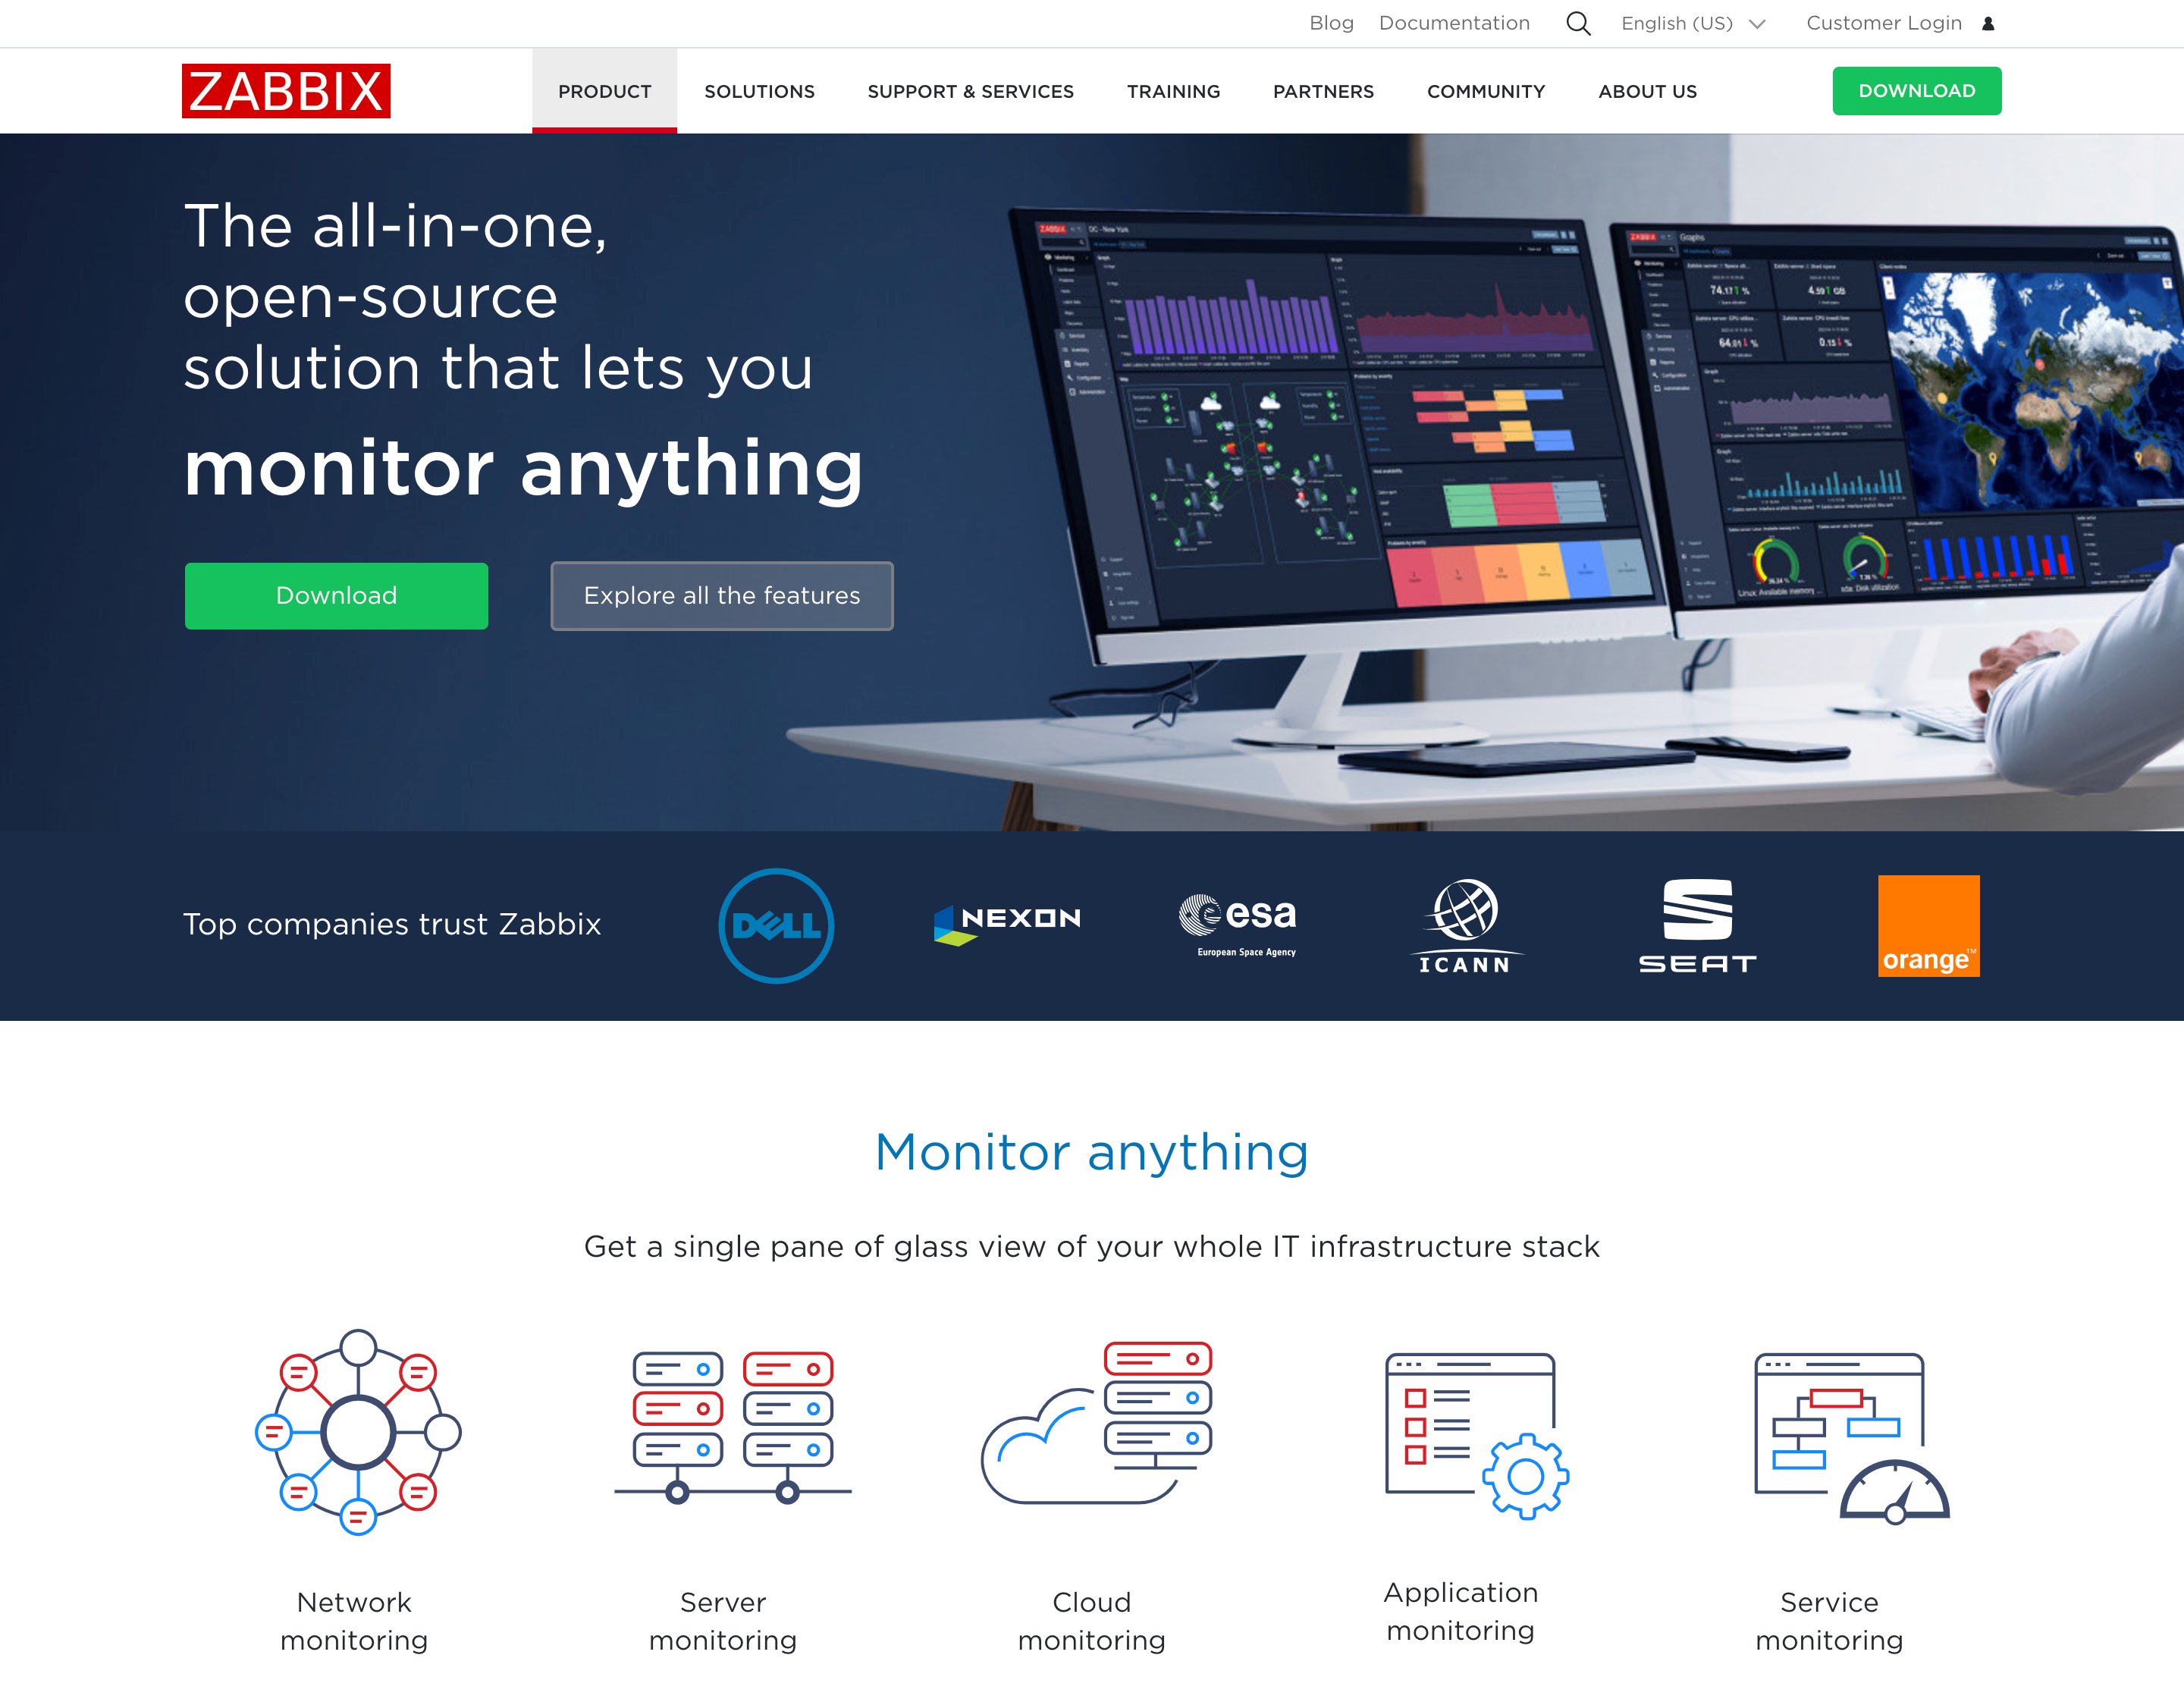
Zabbix, an open-source monitoring tool for diverse IT components, offers comprehensive cloud monitoring features.
It boasts versatile integration with major vendors and existing systems, including Docker containers, and seamlessly integrates with ITSM systems like ServiceNow and Jira ServiceDesk.
With robust Kubernetes monitoring, platform-agnostic cloud monitoring, and VMware connectivity, Zabbix provides thorough visibility.
Key Benefits and Features
- Zabbix is highly customizable and suitable for diverse IT environments.
- The solution offers robust out-of-the-box support for various software and hardware vendors.
- Their benefits include API customization to support automation workflows.
- Their real-time data streaming facilitates adaptive system behavior, making Zabbix a flexible and robust solution for diverse IT infrastructure and application monitoring needs.
Pricing
Zabbix offers a comprehensive free plan under the GPL license for both commercial and non-commercial use. Zabbix is a professionally developed open-source software, free of limits and hidden charges. The tool emphasizes its commitment to transparency and cost-effectiveness, giving it a spot on our list.
Better Stack
Better Stack emerges as a powerful, user-friendly, and cost-effective cloud monitoring solution, featuring log management for centralized, fast log searching and observability dashboards for enhanced visualization. It focuses on downtime resolution and efficiency, monitoring websites to servers, incident management, and actionable alerts.
Key Benefits and Features
- Advanced log management capabilities and collaboration features, with aggregation and querying of log data.
- With a community of over 150,000 developers, Better Stack provides access to a wealth of technical articles and open-source projects.
- Observability dashboard designed to enhance user experience.
Pricing
BetterStack prices start at $24 per month. BetterStack’s free plan includes 1 GB of data per month, data is retained for three days, and users can connect up to 5 different data sources.
Logz.io
Logz.io offers a suite of cloud monitoring tools powered by popular open-source technologies. Their platform prioritizes high-performance log analytics at any scale, powered by OpenSearch, allowing for efficient log management and analysis.
They offer metric analytics. using Prometheus for comprehensive metrics tracking. Logz.io performs trace analytics with OpenTelemetry and Jaeger for visualizing requests across microservices, aiding in issue isolation and resolution. Their platform also allows for centralizing and investigating all security events and threats, enhancing overall cloud security.
Key Benefits and Features
- Logz.io is powered by open-source technologies.
- Based on the ELK stack, Logz.io ensured reliability and performance.
- Logz.io’s focus on visualizing microservices interactions helps quickly isolate and resolve issues, making it a strong contender for organizations seeking a robust, integrated, and user-friendly cloud observability and security platform.
Pricing
Logz.io price starts at $1.09 per month. Logz.io’s free plan offers daily 3 GB of log data, a three-day log retention period, and community support. This plan is suitable for small teams or individual projects.
Netdata Cloud
Netdata’s uniqueness lies in its real-time insights and comprehensive observability across physical and virtual infrastructures. Its simple yet powerful setup, with automated dashboards and alerts, amplifies troubleshooting capabilities.
The platform’s wide array of integrations, AI-driven anomaly detection, and scalable architecture, combined with a strong commitment to data privacy and security, give it strong potential as a cloud monitoring tool.
Key Benefits and Features
- Users can deeply analyze data, enjoy comprehensive and intelligent alerting, benefit from AI-driven anomaly detection, and experience scalable, cost-efficient monitoring.
- Netdata provides real-time metric streaming from all servers, containers, and IoT devices to a unified dashboard to enhance user experience.
- Users can collaborate on troubleshooting as a team and use Netdata’s AI tool.
- Netdata Cloud aims for simple installation with automated dashboards and pre-configured alerts, extensive integrations using open standards, and real-time insights into system and application micro-behavior.
Pricing
Prices start at $3 per node monthly. Netdata’s free plan offers extensive real-time monitoring and alerting capabilities, with access to all basic features. It includes detailed visualizations, hundreds of integrations, AI-powered anomaly detection, and a user-friendly interface.
Sumo Logic
Sumo Logic offers scalable cloud monitoring for public, hybrid, and multi-cloud environments. It can integrate logs, metrics, and events from AWS, Azure, and GCP.
These integration capabilities provide Amazon Web Services monitoring with a one-click cloud-to-cloud collection and extensive service coverage.
Azure monitoring features simple integration and complete visibility into Azure infrastructure. Sumo Logic eliminates blind spots in cloud applications and uses machine learning for pattern detection. It supports microservices technologies, offering a unified platform for modern cloud monitoring.
Key Benefits and Features
- Extensive multi-cloud support covers the most popular service providers
- Deep integration and comprehensive visibility into each cloud’s services.
- Utilizes machine learning for pattern detection and problem-solving.
- Security analytics and CrowdStrike threat intelligence.
Pricing
Prices start at $3.30 per GB. Sumo Logic’s free plan offers basic features for cloud monitoring, including data collection, analysis, and dashboard visualization. The free plan provides a glimpse into Sumo Logic’s full capabilities, allowing users to explore its functionalities without financial commitment.
Grafana
Grafana Cloud integrates top open-source technologies into a comprehensive observability platform, enabling easy switching between metrics, logs, and traces for quick root cause analysis and reduced recovery time. It offers pre-built integrations for rapid monitoring setup, including popular infrastructure components.
The platform features cloud dashboards for querying, visualizing, and alerting on metrics, supporting a data-driven culture.
Additionally, Grafana Cloud includes a scalable Prometheus instance for monitoring cloud-native applications and infrastructure, offering high-performance metrics storage and retention.
Key Benefits and Features
- Includes an expansive range of pre-built integrations.
- Uses advanced cloud dashboards for detailed data analysis.
- Highly scalable, performance-oriented Prometheus instance for comprehensive cloud-native monitoring.
Pricing
Grafana Cloud Pro starts at $29 per month. Grafana’s free plan offers essential features like basic observability through metrics, logs, and traces, access to various integrations, and the ability to create and share dashboards.
Prometheus
Prometheus is a powerful cloud monitoring tool known for its multidimensional data model with time series data identified by metric names and key/value pairs. It features PromQL, a flexible query language that maximizes its dimensional data model.
Prometheus offers centralization using single server nodes, as these nodes are autonomous, with no reliance on distributed storage. Prometheus also supports pushing time series through an intermediary gateway. Among other features are discovering targets via service discovery or static configuration and providing multiple graphing and dashboarding support modes.
Key Benefits and Features
- Designed for reliability, Prometheus handles highly dimensional data with ease.
- Its query language, PromQL, allows for precise and flexible data retrieval.
- The tool’s pull-based model simplifies gathering metrics and supports automatic service discovery.
Pricing
Prometheus is an open-source tool, meaning its entire feature set is free. This includes its powerful metrics collection, efficient storage, query language PromQL, and visualizations. Users can utilize Prometheus to monitor a wide range of systems without cost. This is a unique feature compared to many cloud monitoring tools in this list.
Amazon CloudWatch
Amazon CloudWatch is a monitoring service built for AWS cloud resources and the applications you run on AWS daily. It can collect and track metrics, collect and monitor log files, and set alarms. It monitors AWS resources like EC2 instances, DynamoDB tables, and RDS DB instances.
It offers system-wide visibility into resource utilization, application performance, and operational health. CloudWatch’s functionalities include dashboard creation, analytics, and insights, which aid in optimizing application performance and resource utilization.
Key Benefits and Features
- Deep integration capability with AWS services, offering extensive and detailed monitoring capabilities for AWS resources.
- Provides a unified view of AWS resources, applications, and services that run on AWS and on-premises servers.
Pricing
Prices start at $0.50 per GB for the first 10TB. The more you use – the cheaper the price per 1 GB. The Amazon CloudWatch free tier offers basic monitoring for AWS services.
Google Cloud’s Operations Suite (formerly Stackdriver)
Google Cloud’s operations suite, formerly Stackdriver, is a set of tools for monitoring, logging, and diagnosing infrastructure and applications on Google Cloud and Amazon Web Services. It offers real-time log management, error reporting, trace analysis for performance insights, and cloud monitoring with advanced metrics.
The suite integrates with Google Cloud services, providing a unified platform for uptime monitoring, system health checks, and incident management. Ultimately, they aim to enhance the reliability and performance of cloud applications for their users.
Key Benefits and Features
- Advanced AI and machine learning capabilities, offering predictive insights and anomaly detection.
- Integrates with Google Cloud Platform (GCP) and AWS to ensure comprehensive monitoring across cloud environments.
- Designed to have a user-friendly interface and extensive documentation to support efficient cloud operations and troubleshooting for users.
Pricing
Prices start at $0.01 per GB, retainable within 30 days. Google Cloud’s operations suite offers a generous free tier, including basic access to all its key features. Users can enjoy log management with 50 GB of log ingestion per month, error reporting, and cloud monitoring with basic metrics.
Microsoft Azure Monitor
Azure Monitor is a comprehensive cloud monitoring tool that provides full-stack monitoring, advanced analytics, and automated insights across applications, infrastructure, and networks. It collects data from various sources like applications, OS, and Azure resources.
Key features include application performance monitoring, log analytics, and integration with Azure services. Azure Monitor offers real-time insights, diagnostics, and visualizations, aiding in proactive issue resolution and performance optimization.
Key Benefits and Features
- Integration within the Azure ecosystem, offering native monitoring for Azure services.
- Advanced analytics with AI-driven insights and machine learning capabilities for proactive issue detection and resolution.
- Ability to correlate infrastructure and application data, offering a unified view for better visibility and control.
Pricing
Prices start at $0.50 per GB. Azure Monitor’s free plan includes basic monitoring features like metrics and log data collection from Azure resources. Users get access to a set of standard metrics and basic alerting capabilities.

FAQ on the Best Cloud Monitoring Tools
Which is the best cloud monitoring tool?
The best cloud monitoring tools include Datadog, Dynatrace, New Relic, Sumo Logic, PagerDuty, and numerous others. Additionally, you can monitor the statuses of cloud services with SatusGator on a single status page.
What is a cloud monitoring tool?
Cloud monitoring tool is software that allows for evaluating the health of cloud-based IT infrastructures. Using cloud-monitoring tools, organizations can proactively monitor their cloud environments’ availability, performance, and security to find and fix problems before they impact the end-user experience. The top cloud monitoring solutions include Datadog, Sumo Logic, Logz.io, and numerous others.
How do you monitor the cloud?
Users monitor cloud operations by typically observing cloud usage, fees, metrics/analytics, and events that affect your bottom line. Triggers and data rules are involved to centralize data, and user experience is monitored.
Is cloud monitoring free?
Cloud monitoring solutions that are free, often open source, including Zabbix, Nagios Core, and Prometheus, are effective. Typically, most tools have a paid plan to unlock all features. Many also include a free, limited trial.
How can you best monitor the cloud network?
The best way to monitor the cloud network is by measuring various metrics, such as query performance, index usage, lock statuses, and many more. You can also monitor CPU usage, memory usage, disk I/O, and network usage. The solutions to check for cloud network monitoring include Datadog, Dynatrace, and Nagios XI.