
Your Datadog dashboards tell you what’s happening inside your infrastructure. StatusGator helps you understand what’s happening with the vendors and services your business depends on.
Now you can bring both together.
Embedded incident visibility
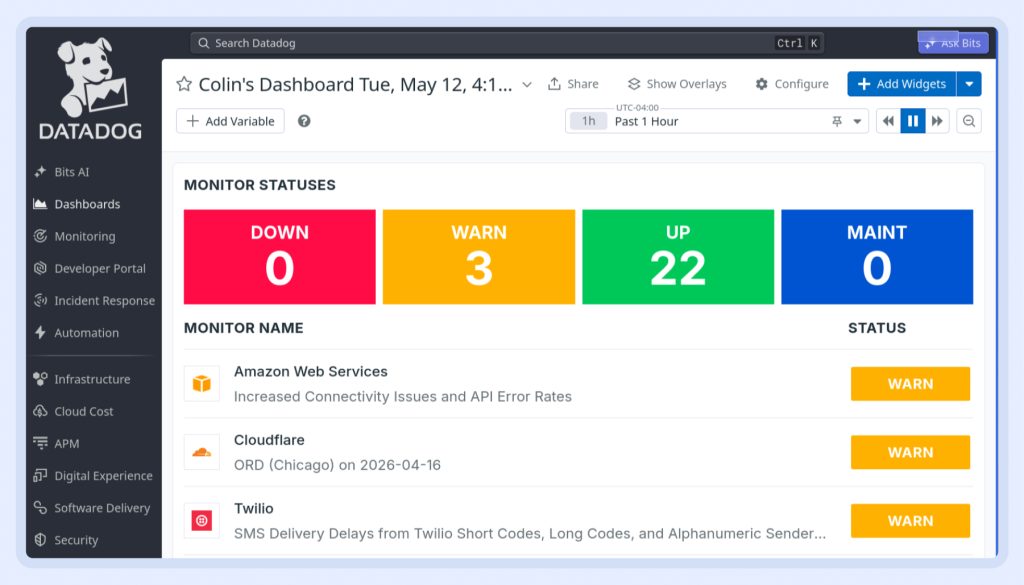
With the new Datadog integration, you can embed StatusGator directly into your Datadog dashboards using a simple iframe widget.
No custom development. No separate application to manage.
Just add the widget and start viewing vendor outages, service disruptions, and dependency health alongside your existing Datadog dashboards. Read help doc for details.
Keep outage intelligence where your team works
When incidents happen, engineers shouldn’t have to open another tool to check whether AWS, Cloudflare, Twilio, Microsoft 365, or another provider is experiencing issues.
By embedding StatusGator inside Datadog, teams can see:
- Active vendor incidents
- Service degradations
- Maintenance events
- Dependency health status
Without leaving their monitoring workflow.
A seamless Datadog experience
The embedded dashboard automatically matches Datadog’s light and dark themes, creating a native experience inside your dashboards.
Your team gets the vendor visibility they need without adding another screen, tab, or dashboard to manage.
Faster answers during incidents
One of the first questions during an outage is:
“Is this us or one of our providers?”
With StatusGator available directly in Datadog, teams can quickly check the status of critical vendors and gain valuable context while investigating issues.
One dashboard. More context.
Datadog helps you monitor your systems.
StatusGator helps you monitor the services your systems rely on.
Together, they provide a more complete view of operational health – bringing vendor outage intelligence directly into the dashboards your team already uses every day.