As IT infrastructures grow more complex, having the right Meraki monitoring tools is essential for maintaining network health, performance, and security.
Cisco Meraki offers cloud-managed solutions, but some organizations need additional monitoring software to gain deeper insights, improve efficiency, and proactively address issues.
In this article, we’ll explore the top Meraki monitoring tools that help IT teams manage and optimize their networks effectively.
Why use Meraki monitoring tools?
Cisco Meraki provides a cloud-based dashboard for managing network devices, but it has some limitations when it comes to advanced monitoring and analytics compared to Meraki alternatives. Dedicated Meraki monitoring software allows businesses to:
- Gain real-time visibility into network performance
- Set up automated alerts for potential issues
- Track historical data for better trend analysis
- Enhance security and compliance measures
- Optimize resource allocation and troubleshooting efforts
We’ve also reviewed Meraki alternatives for managing mobile devices in one of our previous blog articles. But make sure you stick around as we review how you can monitor thousands of cloud services that you depend on and with Meraki devices in an all-in-one view.
Best Cisco Meraki monitoring tools
- StatusGator
- Paessler PRTG
- SolarWinds NPM
- Auvik
- Domotz
- StatSeeker
- ThousandEyes
- LogicMonitor
- Datadog
- N-sight RMM
1. StatusGator

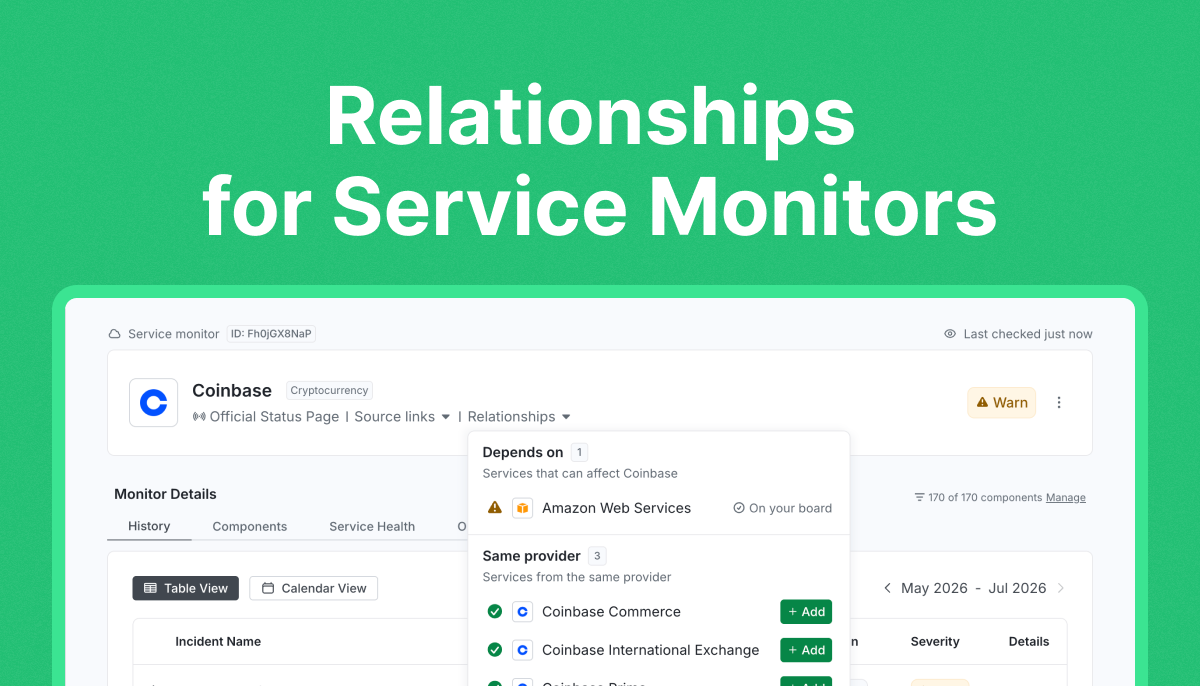
While StatusGator isn’t a traditional network performance monitoring tool like others on this list, it plays a crucial role in ensuring your Cisco Meraki-dependent infrastructure stays operational. By integrating with the Cisco Meraki private status ingestion feature, users can monitor the connectivity of their Cisco Meraki devices directly from StatusGator.
This integration ensures that you can track the health of your network infrastructure, including Meraki devices, and receive real-time updates on connectivity issues.
Features:
- Connectivity monitoring: Track the status of your Cisco Meraki devices and ensure network infrastructure health in real time.
- Hassle-free integration: Connect your Meraki devices to StatusGator for streamlined monitoring of connectivity and network status.
- Customizable region selection: Choose the region where your Meraki devices are located for precise monitoring and accurate status updates.
- Instant alerts: Receive notifications whenever there is a change in connectivity, enabling quick responses to network issues.
- Consolidated visibility: Gain full visibility into the status of your third-party dependencies and the connectivity of your Cisco Meraki devices.
- Early warning signals: Stay ahead of disruptions and outages before cloud services officially acknowledge them.
- Numerous integrations: Supports integration with Slack, PagerDuty, and other platforms.
If you’re looking for tools that provide device-level monitoring, performance analytics, and traffic analysis, keep reading. We’ll cover the best Meraki network monitoring solutions next.

2. Paessler PRTG Network Monitor
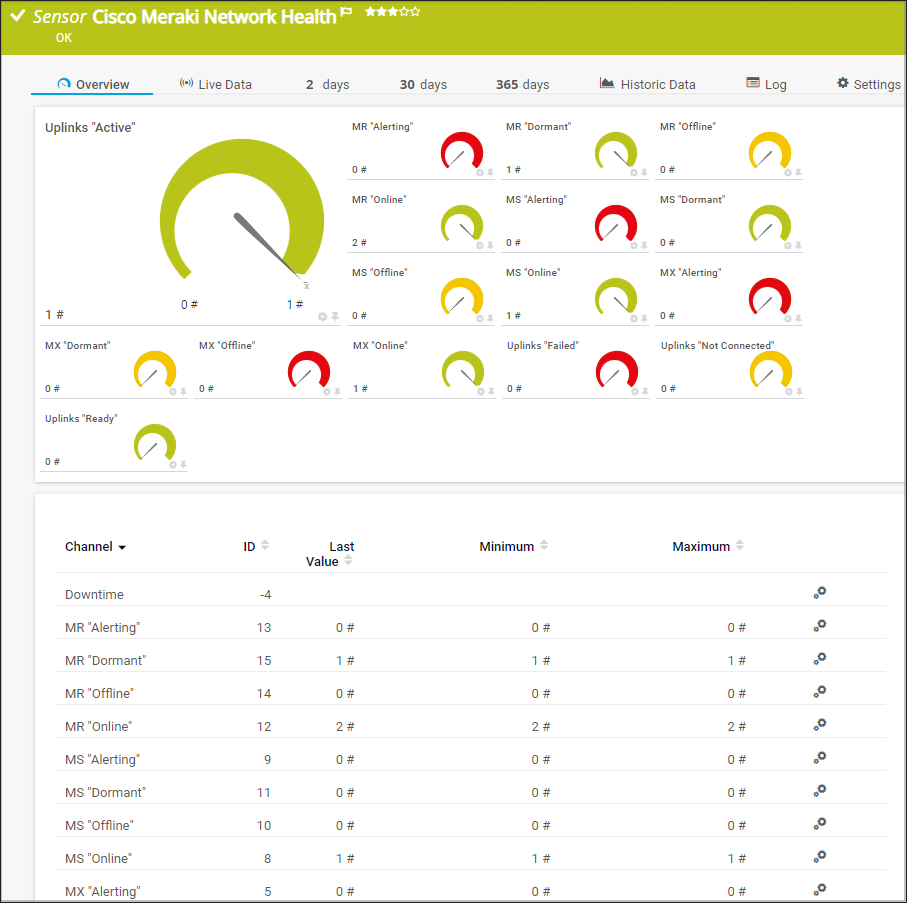
PRTG Network Monitor by Paessler is a comprehensive monitoring solution that supports Cisco Meraki devices. As an official Cisco Meraki technology partner, Paessler has developed PRTG to integrate seamlessly with Meraki’s cloud-managed infrastructure, providing IT teams with unified visibility across their entire network. With real-time, round-the-clock monitoring, PRTG helps identify and prevent availability, health, and performance issues in Cisco Meraki equipment.
Features:
- Auto-discovery of Meraki devices
- Custom dashboards for performance visualization
- Bandwidth and traffic analysis
- Real-time alerts and notifications
- Multiple language support
3. SolarWinds Network Performance Monitor (NPM)
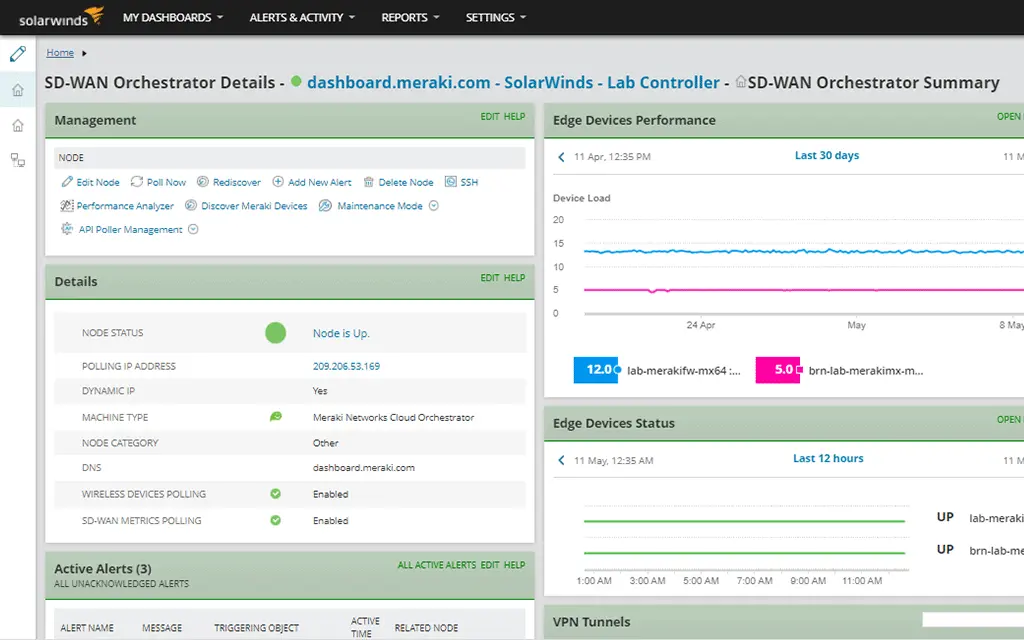
SolarWinds NPM is a key feature of SolarWinds Observability Self-Hosted. This feature enhances Cisco Meraki monitoring by providing deep visibility into network performance.
By integrating seamlessly with Meraki’s cloud-managed infrastructure, NPM enables IT teams to monitor wireless devices, switches, and security appliances effectively. Administrators can add Meraki organizations to NPM as external nodes, allowing the platform to poll information from the cloud and display data in the SolarWinds Platform Web Console.
Features:
- Intelligent alerts to identify network anomalies
- Customizable reports and trend analysis
- Seamless integration with Meraki APIs
- NetPath and PerfStack tools for troubleshooting
4. Auvik

Auvik is a cloud-based network monitoring tool that enhances Meraki device management with automated mapping and performance insights, particularly for managed service providers (MSPs).
Traditional network management has been a manual and time-consuming process, but Auvik streamlines it by leveraging automation to handle critical tasks efficiently. The platform automatically discovers network devices, maps them visually, inventories configurations in real time, and provides deep network insights to reduce troubleshooting time.
With Auvik, IT teams gain remote access to nearly any network device from a single interface, making network administration more efficient and proactive.
Features:
- Automated network discovery
- Real-time network visibility and alerting
- Traffic analysis and device performance tracking
- Cloud-based access from anywhere
5. Domotz

By integrating with the Cisco Meraki Cloud via API, Domotz offers real-time performance monitoring, automation, and proactive alerting, helping IT teams gain deeper insights into their network infrastructure.
Unlike traditional network monitoring tools, Domotz goes beyond basic health checks by enabling remote management actions. such as rebooting devices, controlling PoE switches, and accessing Meraki device details like firmware versions and serial numbers. Its automated mapping capabilities ensure that every device on the network is identified and visualized in a dynamic topology map, making network management more intuitive and efficient.
Features:
- Device monitoring and performance tracking
- Automated network and device mapping
- Switch port mapping and traffic analysis
- Real-time alerts and notifications
- Remote troubleshooting capabilities
6. StatSeeker

StatSeeker is designed for large-scale environments, supporting up to 1 million interfaces with high-speed data retrieval and granular insights. The Meraki Module enhances visibility across Cisco Meraki MX, MR, MS, MT, and MV devices, consolidating Meraki and non-Meraki infrastructure into a single view. This eliminates the need for multiple tools while improving control over network performance, security, and compliance tracking.
Unlike some traditional monitoring tools, StatSeeker provides long-term, high-resolution data storage without roll-ups or graph smoothing. This allows for more accurate capacity planning and trend analysis. It also delivers near real-time monitoring, offering details on client throughput, wireless latency, application data, security logs, VPN traffic, and interface metrics.
Features:
- Supports multiple Meraki technologies and devices (MX, MR, MS, MT, and MV)
- Global single pane of glass that consolidates Meraki and non-Meraki infrastructure monitoring into one dashboard
- Automatically detects and adds new devices without manual intervention
- Long-term high-resolution data storage
- Scalable for large networks
7. ThousandEyes

ThousandEyes, now part of Cisco, provides deep network intelligence and end-to-end visibility for organizations using Meraki. It offers real-time monitoring, proactive outage detection, and detailed performance insights to help IT teams optimize their Meraki networks.
By integrating seamlessly with Meraki MX security and SD-WAN appliances, ThousandEyes enhances WAN, cloud, and SaaS visibility, ensuring a superior digital experience for users.
With ThousandEyes Meraki MX integration, IT teams gain instant insights into network performance across on-prem, cloud, and hybrid infrastructures. This includes granular path visualization, packet loss detection, latency tracking, and application performance monitoring.
ThousandEyes helps organizations quickly pinpoint and resolve network slowdowns, connectivity issues, and security vulnerabilities before they impact business operations.
Features:
- Detailed analytics on Meraki SD-WAN, security appliance traffic, and connectivity issues
- Real-time outage detection and performance monitoring
- Comprehensive network security monitoring
- Path Visualization & Troubleshooting
8. LogicMonitor

LogicMonitor is a SaaS-based network monitoring platform designed to enhance visibility, performance, and troubleshooting across IT and network environments
With its Cisco Meraki integration, LogicMonitor provides a powerful suite of performance monitoring, forecasting, and capacity planning tools, helping organizations manage, optimize, and secure their Meraki device infrastructure.
By supporting Meraki security appliances, wireless access points, switches, and smart cameras, LogicMonitor enables real-time monitoring, alerting, and analysis to proactively detect and resolve network performance issues.
Its hybrid and multi-cloud infrastructure visualization ensures that organizations maintain seamless connectivity across distributed environments.
Features:
- Cloud and hybrid infrastructure support for Meraki networks across on-prem, cloud, and hybrid deployments
- End-to-end monitoring to track availability, health, and performance of Meraki security appliances, access points, switches, and cameras.
- Real-time topology maps and performance graphs
- VPN monitoring and issue triage
9. Datadog
Datadog integration for monitoring Cisco Meraki devices provides deep visibility into network performance and security. By collecting metrics and logs from Meraki devices, Datadog enables IT teams to monitor the health and performance of their network infrastructure effectively.
By integrating Cisco Meraki with Datadog, organizations can achieve a unified and detailed perspective of their network. The solution collects metrics such as bandwidth utilization and device status to ensure optimal network performance.
Features:
- Network device monitoring for Automatic discovery and monitoring of Meraki devices.
- Network and security event logs from Meraki devices to uncover potential security threats
- Security event analysis with Datadog’s Cloud SIEM to analyze security event logs from Meraki MX Security Appliances
- Unified monitoring platform with over 850 other technologies
10. N-sight RMM

N-able N-sight RMM is an all-in-one Remote Monitoring and Management (RMM) solution designed for Managed Service Providers (MSPs). It integrates IT management, remote access, ticketing, and billing into a single platform, offering an affordable and scalable solution for improving operational efficiency and profitability.
Through a strategic partnership with Cisco Meraki, N-able N-sight enables streamlined monitoring and management of Meraki devices via the N-central dashboard. This integration enhances network oversight, allowing MSPs to track device status, network health, security events, and bandwidth usage—all from a centralized view.
Features:
- View the status of Meraki security appliances, access points, and switches
- Receive real-time alerts on device status, security events, and network health
- Monitor bandwidth usage, device performance scores, and traffic patterns to optimize network efficiency
- Automation for network reducing manual work and improving scalability
Choosing the right Meraki monitoring tool
Selecting the right Meraki monitoring tool depends on your network’s needs and the IT team’s requirements. Factors to consider include:
- Scalability: Can the tool handle network expansion?
- Integration: Does it work seamlessly with Meraki and other IT tools?
- Customization: Can it provide tailored alerts and reports?
- Ease of Use: Is the dashboard user-friendly?
- Support & Updates: Does the vendor offer reliable support and regular updates?
Summary
Investing in Meraki monitoring tools can significantly enhance network performance, security, and reliability. Whether you need real-time alerts, advanced analytics, or environmental monitoring, there’s a solution that fits your requirements. Evaluate the options listed above and choose the best Cisco Meraki monitoring software to optimize your IT infrastructure.
Don’t miss out on StatusGator’s integration with Cisco Meraki, which allows you to centralize status monitoring of your Meraki devices directly from your StatusGator account. Get real-time visibility and proactive alerts—start monitoring today!

FAQ
What Is the best Cisco Meraki monitoring tool?
The best Cisco Meraki monitoring tool depends on your needs, but popular options include Datadog, LogicMonitor, and ThousandEyes. StatusGator is a great choice for Meraki users, as it integrates with Meraki’s private status ingestion feature, allowing you to monitor Meraki devices directly from your StatusGator account.
What Is Cisco Meraki?
Cisco Meraki is a cloud-managed IT solution that simplifies network management by providing a centralized web-based dashboard. It supports wireless access points, security appliances, switches, and more, making it easier to deploy, configure, and monitor networks remotely.
Why Monitor Cisco Meraki?
Monitoring your Meraki infrastructure helps optimize performance, improve security, allocate resources efficiently, enable proactive maintenance, and ensure compliance with regulations like PCI-DSS, HIPAA, and GDPR.