With the SaaS market valued at approximately $250 billion in 2025 and projected to reach $299 billion by the end of the year, businesses are increasingly relying on SaaS monitoring tools to ensure the optimal performance of their cloud applications.
Ensuring the availability, security, and performance of these applications is vital to maintaining business continuity. That’s where SaaS monitoring tools come into play. These tools help IT teams track application performance, detect downtime, and optimize the overall user experience.
This article explores the best SaaS monitoring tools available, key features to look for, and best practices for monitoring SaaS applications effectively.
What Are SaaS Monitoring Tools?
SaaS monitoring tools track and analyze the performance, availability, and security of cloud-based applications. They provide insights into various metrics such as response time, uptime, latency, and API performance, ensuring smooth and uninterrupted service delivery.
Key Features of SaaS Application Monitoring Tools
- Real-time Performance Tracking – Monitor response times, server health, and user activity.
- Downtime Alerts – Get instant notifications when an application experiences an outage.
- Status Pages – Communicate the status of a SaaS app for internal teams or to customers, also aggregated status page, a unique service by StatusGator that consolidates status pages of multiple SaaS providers into a single view.
- User Experience Monitoring – Analyze user interactions and application performance to improve the customer experience.
- Security & Compliance Checks – Ensure SaaS applications adhere to security best practices and regulatory compliance.
- Cost Management – Tracks subscription costs and analyzes usage patterns to optimize spending efficiency.
Best SaaS Monitoring Tools
- StatusGator
- Datadog
- New Relic
- SolarWinds (AppOptics, Pingdom, Loggly)
- Sentry
- Atatus
- ManageEngine (Site24x7, Applications Manager, OpManager)
- LogicMonitor
- Nagios
- AppDynamics
1. StatusGator

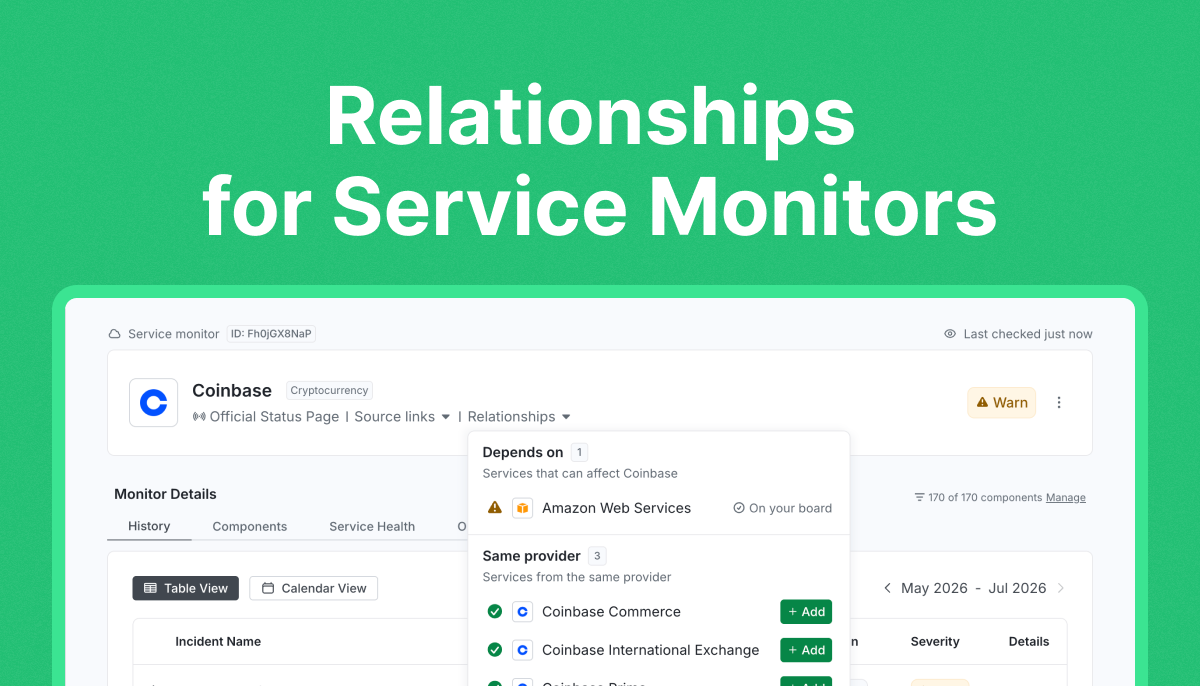
StatusGator is a unique SaaS monitoring solution that goes beyond traditional application performance monitoring (APM) by aggregating and tracking the status of third-party cloud services.
For SaaS providers, ensuring uptime and transparency is critical—not just for their own platform but for the various cloud dependencies they rely on.
Unlike other monitoring tools, StatusGator offers built-in website and third-party service monitoring, enabling SaaS companies to track their infrastructure, hosting providers, and integrations all in one place. With customizable public and private status pages, businesses can keep their teams informed about outages affecting their stack while proactively updating customers to reduce support tickets.
Early Warning Signals: Get Notified Before an Outage Escalates
One of StatusGator’s standout features is Early Warning Signals, which detects service disruptions before official acknowledgments. Many SaaS businesses rely on critical third-party services like Square, Stripe, and AWS. But waiting for an official status page update can mean lost revenue and productivity.
For example, during the February 26, 2025, Square outage, merchants were left unable to process payments for over two hours. While Square acknowledged the issue at 3:32 PM ET, StatusGator detected and alerted users five minutes earlier, allowing IT teams to respond proactively.
With real-time reports and service anomaly detection, StatusGator provides:
- Faster outage detection for over 5,000 cloud apps.
- Instant alerts via email, Slack, Teams, and more to keep IT teams ahead of disruptions.
- Aggregated status page data from thousands of SaaS services to provide a comprehensive outage overview.
Key Benefits for SaaS Providers:
- Monitor all cloud dependencies alongside your own infrastructure to detect outages before they impact your users.
- Reduce support tickets by proactively notifying customers of incidents and scheduled maintenance.
- Create a branded, public status page to maintain transparency and trust with your users.
- Enhance internal monitoring with a private status page for IT teams to track providers and third-party services.
- Private status ingestion feature for monitoring private APIs (Enterprise-only).
For companies looking to optimize SaaS uptime monitoring, streamline support, and proactively manage service disruptions, StatusGator is an essential tool that traditional APM platforms don’t cover. Try StatusGator for your SaaS monitoring.
2. Datadog

Datadog is a leading cloud-based monitoring and analytics platform, offering real-time insights into SaaS infrastructure, applications, and logs. Designed for large-scale cloud environments, it provides a unified observability solution that helps businesses track application health, optimize infrastructure performance, and detect anomalies before they impact users.
Key features
Real-Time Monitoring & Analytics
- Collects and analyzes logs, metrics, and traces from cloud, on-prem, and hybrid environments.
- AI-driven anomaly detection helps proactively resolve issues before they escalate.
Customizable Dashboards & Visualization
- Drag-and-drop interface allows users to create real-time dashboards in minutes.
- Infrastructure visualization provides a holistic view of cloud infrastructure across different services.
Seamless Integrations
- Integrates with 600+ platforms, including AWS, Azure, Google Cloud, Kubernetes, Docker, Slack, and SaaS applications.
- Monitors services across distributed cloud environments in a single pane of glass.
User Experience & Application Performance Monitoring
- Tracks web and mobile applications to ensure optimal performance and reliability.
- Provides real user monitoring (RUM) for better insights into customer experience.
3. New Relic

New Relic is a full-stack observability for DevOps and SRE teams. The platform designed to help businesses monitor, troubleshoot, and optimize SaaS application performance. It provides full visibility into application health, infrastructure, and real-time user interactions. With a strong focus on DevOps and Site Reliability Engineering (SRE) collaboration, New Relic enables teams to identify performance bottlenecks, improve service reliability, and streamline deployments.
Key features
Full-Stack Application Performance Monitoring (APM)
- Tracks real-time application health, transactions, and dependencies across SaaS environments.
- Helps teams detect and resolve performance bottlenecks before they impact users.
AI-Powered Anomaly Detection & Error Tracking
- Uses machine learning to detect anomalies and predict potential issues.
- Provides automated alerts and insights to speed up incident resolution.
Infrastructure & Deployment Monitoring
- Offers real-time infrastructure monitoring for cloud-native, hybrid, and on-prem environments.
- Monitors deployments to identify how new code changes impact performance.
Collaborative Features for DevOps & SRE Teams
- Shared dashboards and reports improve communication between development and operations teams.
- Integrated with CI/CD pipelines to monitor application changes in real time.
Seamless Integrations for Cloud & DevOps Tools
- Supports AWS, Kubernetes, CI/CD tools, and more for deep observability across the stack.
- Stores all operational data, including logs, in a single platform.
4. SolarWinds

SolarWinds offers a powerful suite of Application Performance Monitoring (APM) tools designed to provide full-stack observability for SaaS applications. By integrating SolarWinds AppOptics, Pingdom, and Loggly, businesses gain end-to-end visibility into SaaS app performance, infrastructure health, and user experience.
AppOptics

- Monitors cloud, on-premises, and hybrid infrastructure, including AWS, Azure, virtual machines, and physical servers.
- Tracks CPU, memory, storage, and network utilization to help analyze infrastructure performance.
- Provides distributed tracing to detect application bottlenecks and live code profiling to pinpoint slow-performing code in Java, .NET, and more.
Pingdom
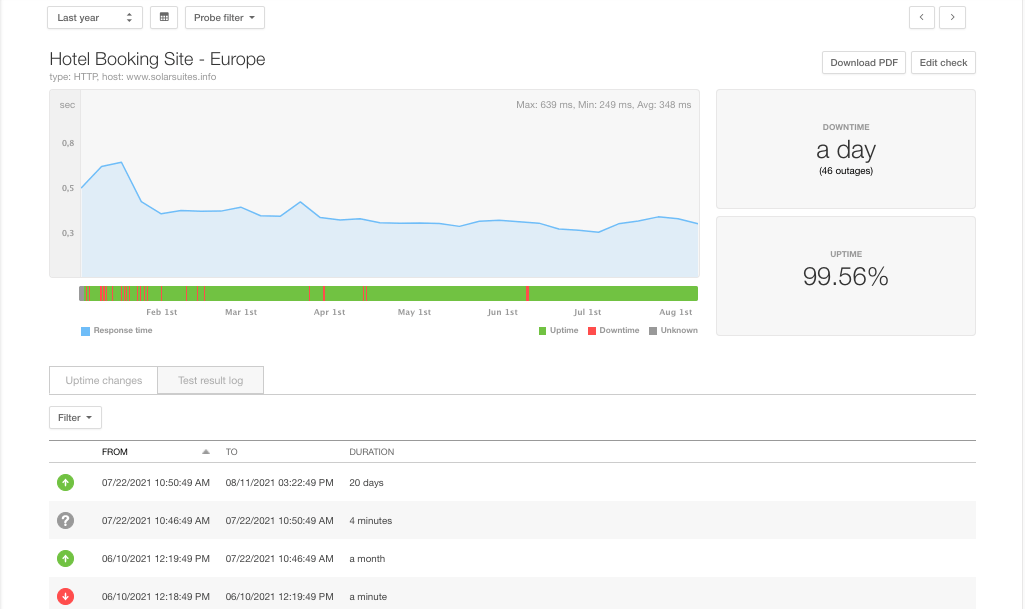
- Monitors application uptime and simulates real user interactions to detect slow-loading pages and downtime.
- Performs automated checks to analyze web performance from different locations worldwide.
- Includes Real User Monitoring (RUM), which collects performance data directly from actual users’ browsers via a lightweight JavaScript snippet.
Loggly

- Collects and analyzes logs from AWS services, databases, mobile apps, and SaaS platforms.
- Delivers instant search results for massive log data sets, speeding up incident resolution.
- Directly integrates with AppOptics and Pingdom to correlate metrics, traces, and logs for complete issue analysis.
5. Sentry
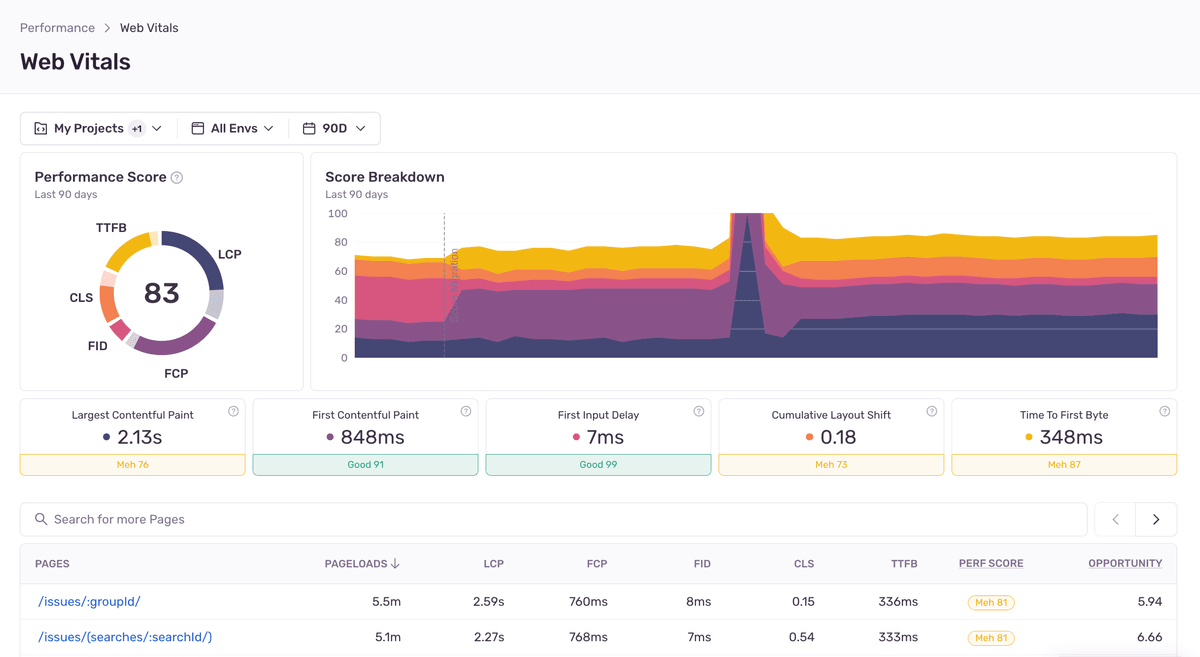
Sentry is a developer-first application monitoring tool designed to help teams identify, diagnose, and fix errors in real time. With deep visibility into application health, Sentry provides actionable insights into broken code, crashes, and failed API calls, enabling developers to resolve issues faster and enhance application performance.
Key features
Application Monitoring & Error Tracking
- Detects errors, crashes, and performance issues across applications.
- Pinpoints the exact broken line of code for faster debugging.
Custom Queries & Dashboards
- Provides custom queries and real-time dashboards to track application health.
- Supports cross-project issue tracking for better visibility across multiple services.
Distributed Tracing for Performance Optimization
- Helps teams trace slow transactions, API calls, and dependencies.
- Offers stack traces and breadcrumbs for context-rich debugging.
Releases & Issue Owners
- Links errors to specific releases, allowing teams to identify which deployment caused the issue.
- Assigns issue owners to streamline debugging and resolution.
6. Atatus

Atatus is a real-time error tracking and performance monitoring tool designed to provide instant visibility into application issues. By detecting and reporting errors the moment they occur, Atatus helps teams minimize downtime, optimize application performance, and enhance user experience.
Key features
Real-Time Error Tracking & Alerts
- Instantly detects errors, crashes, and performance bottlenecks.
- Sends real-time alerts via Slack, JIRA, Webhooks, and more.
Comprehensive Application Performance Monitoring (APM)
- Tracks response times, slow queries, and system bottlenecks.
- Helps identify which parts of the application are underperforming.
User Experience Insights
- Monitors page performance in real time to detect slow-loading pages.
- Provides a deeper understanding of actual user interactions in browser-side applications.
Extensive Integrations for Workflow Optimization
- Seamlessly integrates with Slack, JIRA, Webhooks, and more for efficient issue resolution.
- Ensures teams receive immediate notifications when errors occur.
7. ManageEngine

ManageEngine offers a full suite of monitoring solutions designed to provide deep visibility into networks, applications, and infrastructure performance. Whether you’re tracking network health, application performance, or cloud infrastructure, ManageEngine delivers real-time monitoring, proactive alerts, and detailed analytics to help IT teams optimize system reliability and prevent downtime.
Site24x7

Full-Stack Web & Cloud Monitoring
- Tracks web application health, uptime, and performance metrics.
- Uses AI-powered analytics to identify performance trends and potential failures.
Synthetic & Real User Monitoring (RUM)
- Simulates user interactions with synthetic monitoring to detect bottlenecks.
- Captures real user behavior to optimize the end-user experience.
Cloud & SaaS Integrations
- Supports monitoring across AWS, Azure, and Google Cloud platforms.
ManageEngine Applications Manager
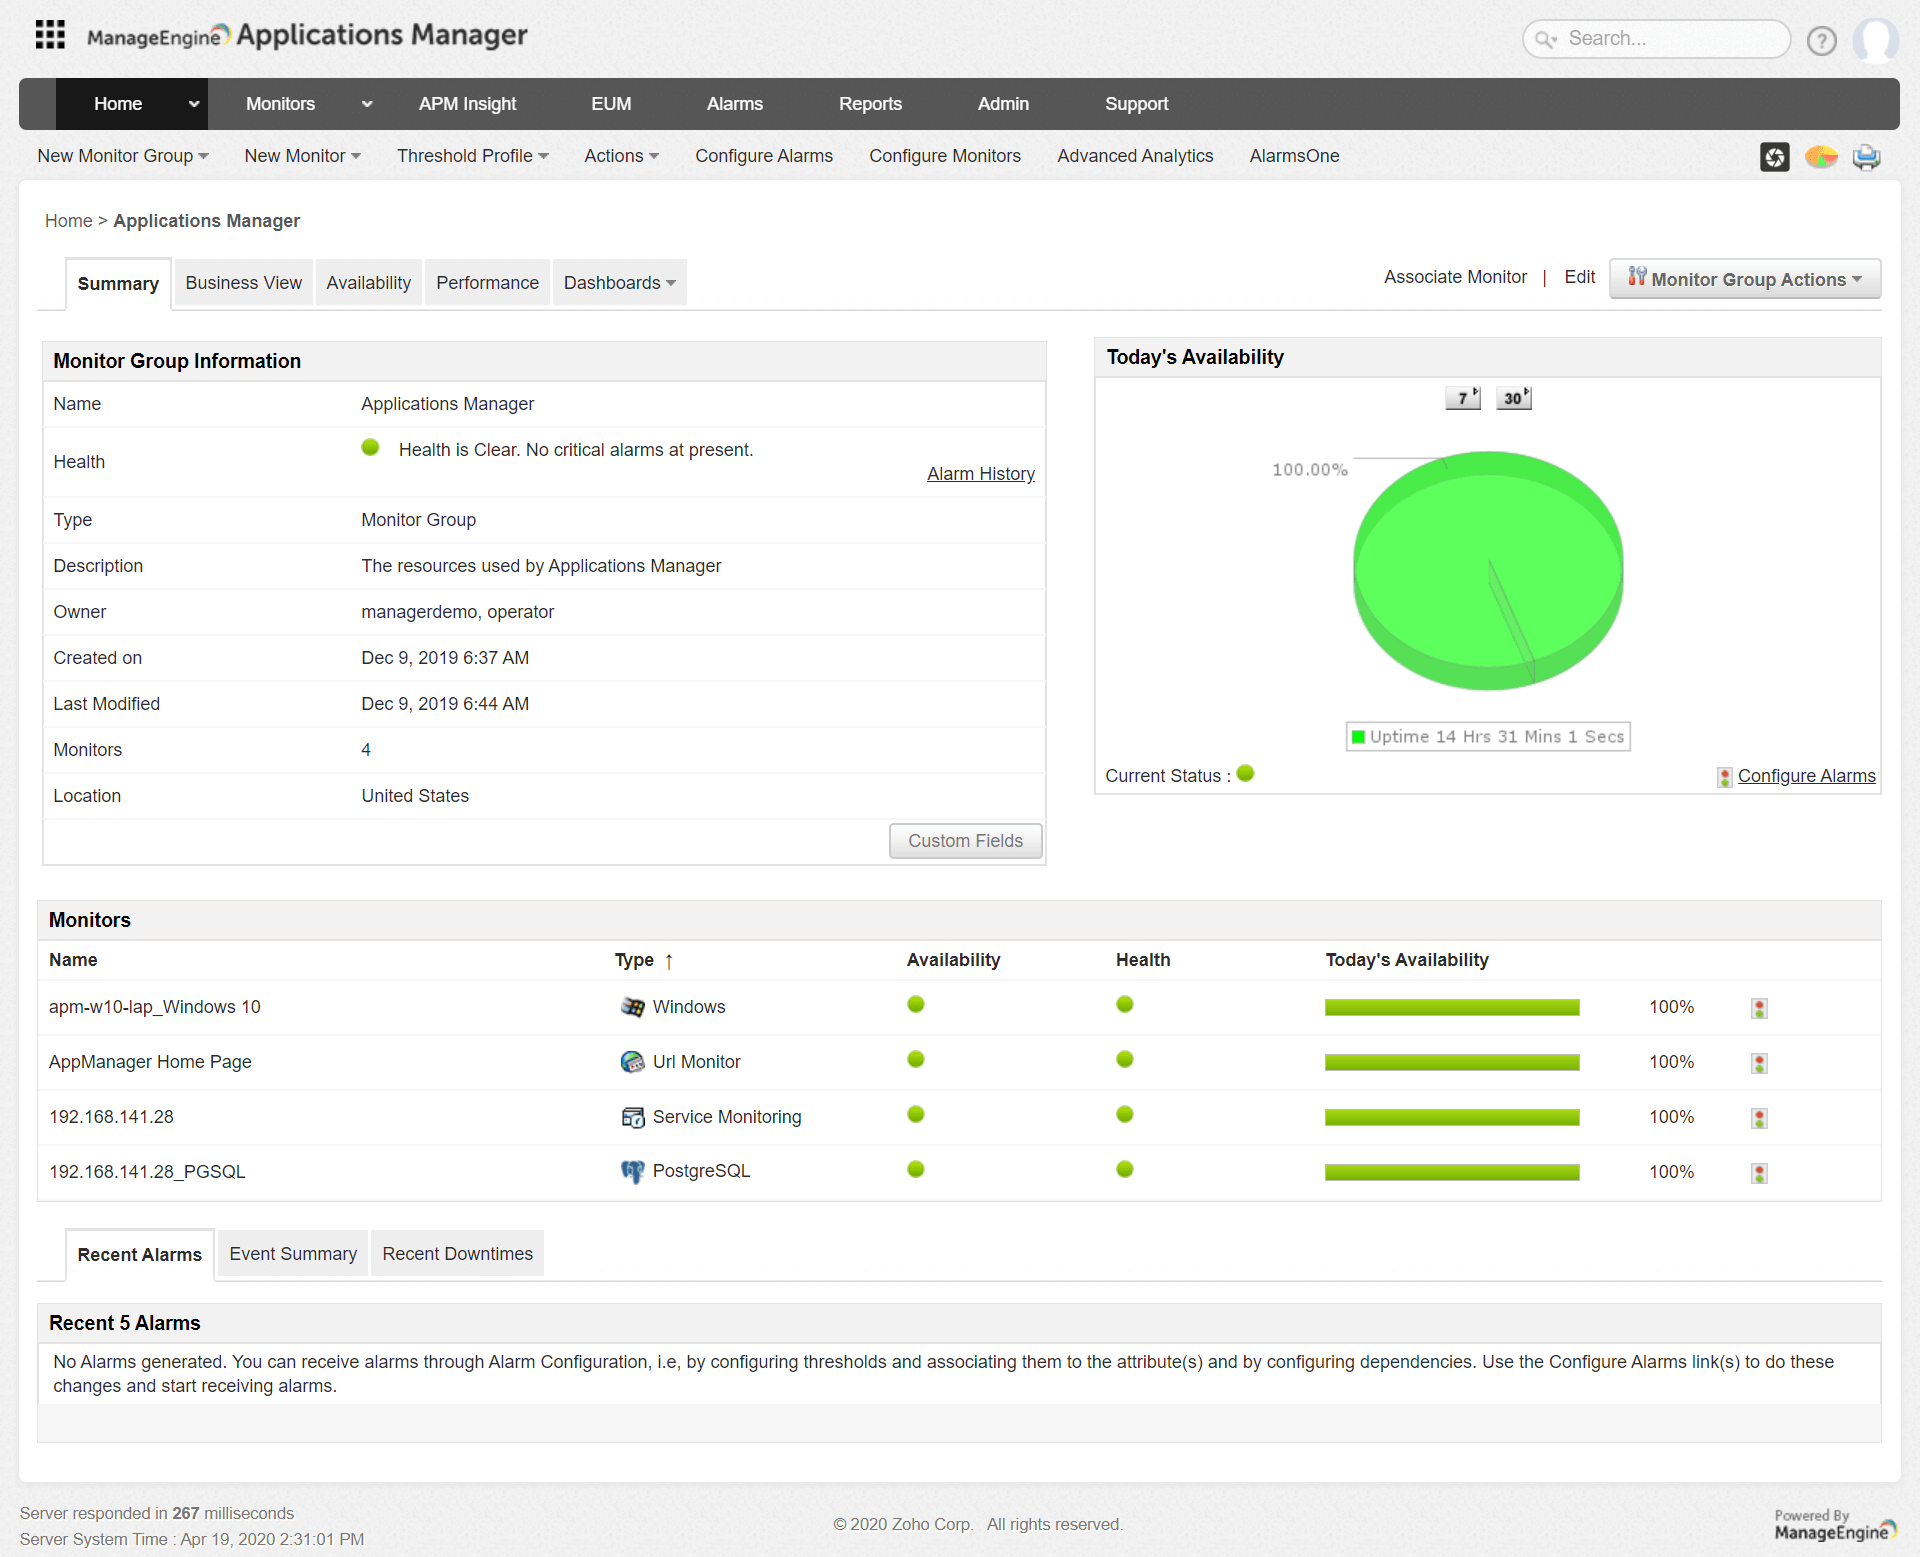
Deep Application Performance Monitoring
- Supports Java, .NET, Python, Ruby, and other programming languages.
- Distributed transaction tracing helps pinpoint slow transactions and optimize performance.
- Application service maps provide a clear view of dependencies and their impact.
Proactive Issue Detection & User Experience Monitoring
- Synthetic transaction monitoring (via Selenium scripts) simulates real user interactions.
- Real user monitoring (RUM) tracks response times by geography, browser, and network.
Wide Integration Support
- Works with AWS, Google Cloud, Microsoft Azure, MySQL, Prometheus, Slack, ServiceNow, and more.
ManageEngine OpManager
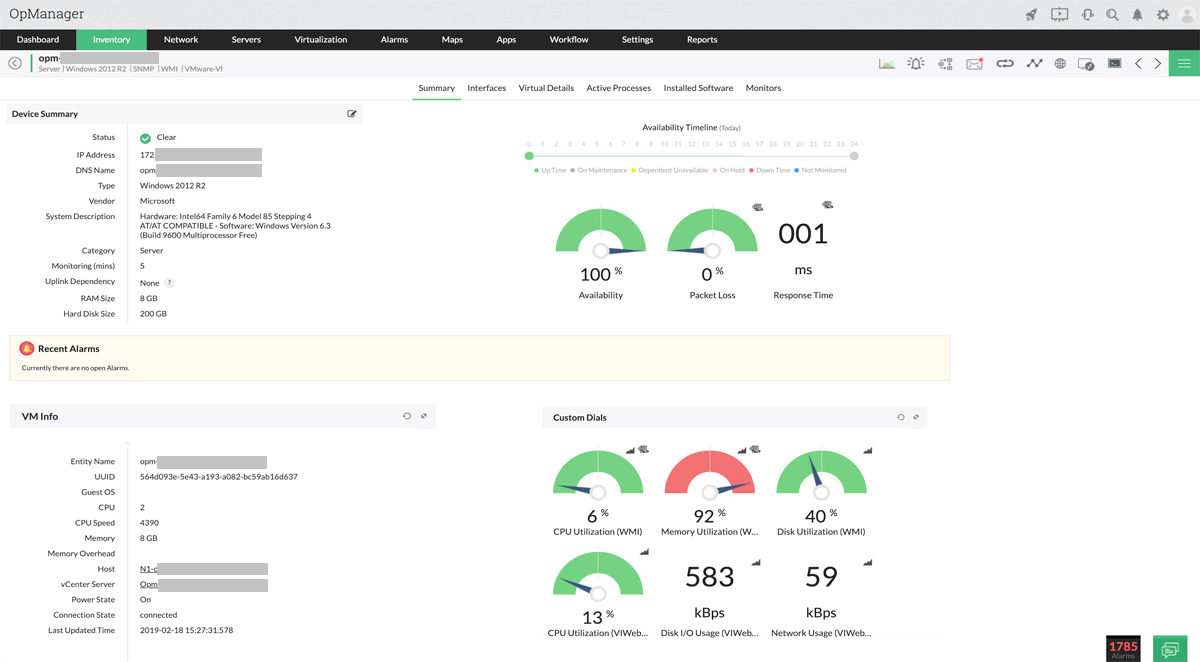
Real-Time Network Monitoring & Performance Insights
- Tracks routers, switches, servers, and virtual machines.
- Monitors latency, packet loss, and response time to prevent downtime.
- Offers 100+ built-in reports for network availability, usage trends, and performance analysis.
Advanced Traffic & Configuration Management
- Analyzes bandwidth usage and identifies top users.
- Enables configuration backups and change tracking for better security.
Seamless Integrations
- Works with ADManager Plus, ADAudit Plus, ServiceDesk Plus, Log360, and more.
8. LogicMonitor

LogicMonitor is a cloud-based observability platform that provides end-to-end monitoring for hybrid infrastructures, covering both on-premises systems and cloud environments. It offers a highly automated approach to tracking performance, ensuring IT teams maintain uptime, optimize resource allocation, and respond to issues proactively.
Key features
Automated Discovery & Monitoring
- Auto-discovers devices, applications, and cloud resources across hybrid environments.
- Uses dynamic thresholds to detect anomalies and prevent performance degradation.
Comprehensive Hybrid Infrastructure Coverage
- Monitors servers, networks, applications, databases, and cloud services (AWS, Azure, GCP, VMware, Cisco, etc.).
- Offers real-time dashboards for unified visibility across all IT assets.
Advanced Alerting & AI-Driven Insights
- Predictive analytics help forecast potential failures before they cause downtime.
- Customizable alerts minimize noise and improve incident response.
Seamless Integrations
- Connects with ServiceNow, Slack, Microsoft Teams, JIRA, and DevOps tools for streamlined workflows.
9. Nagios
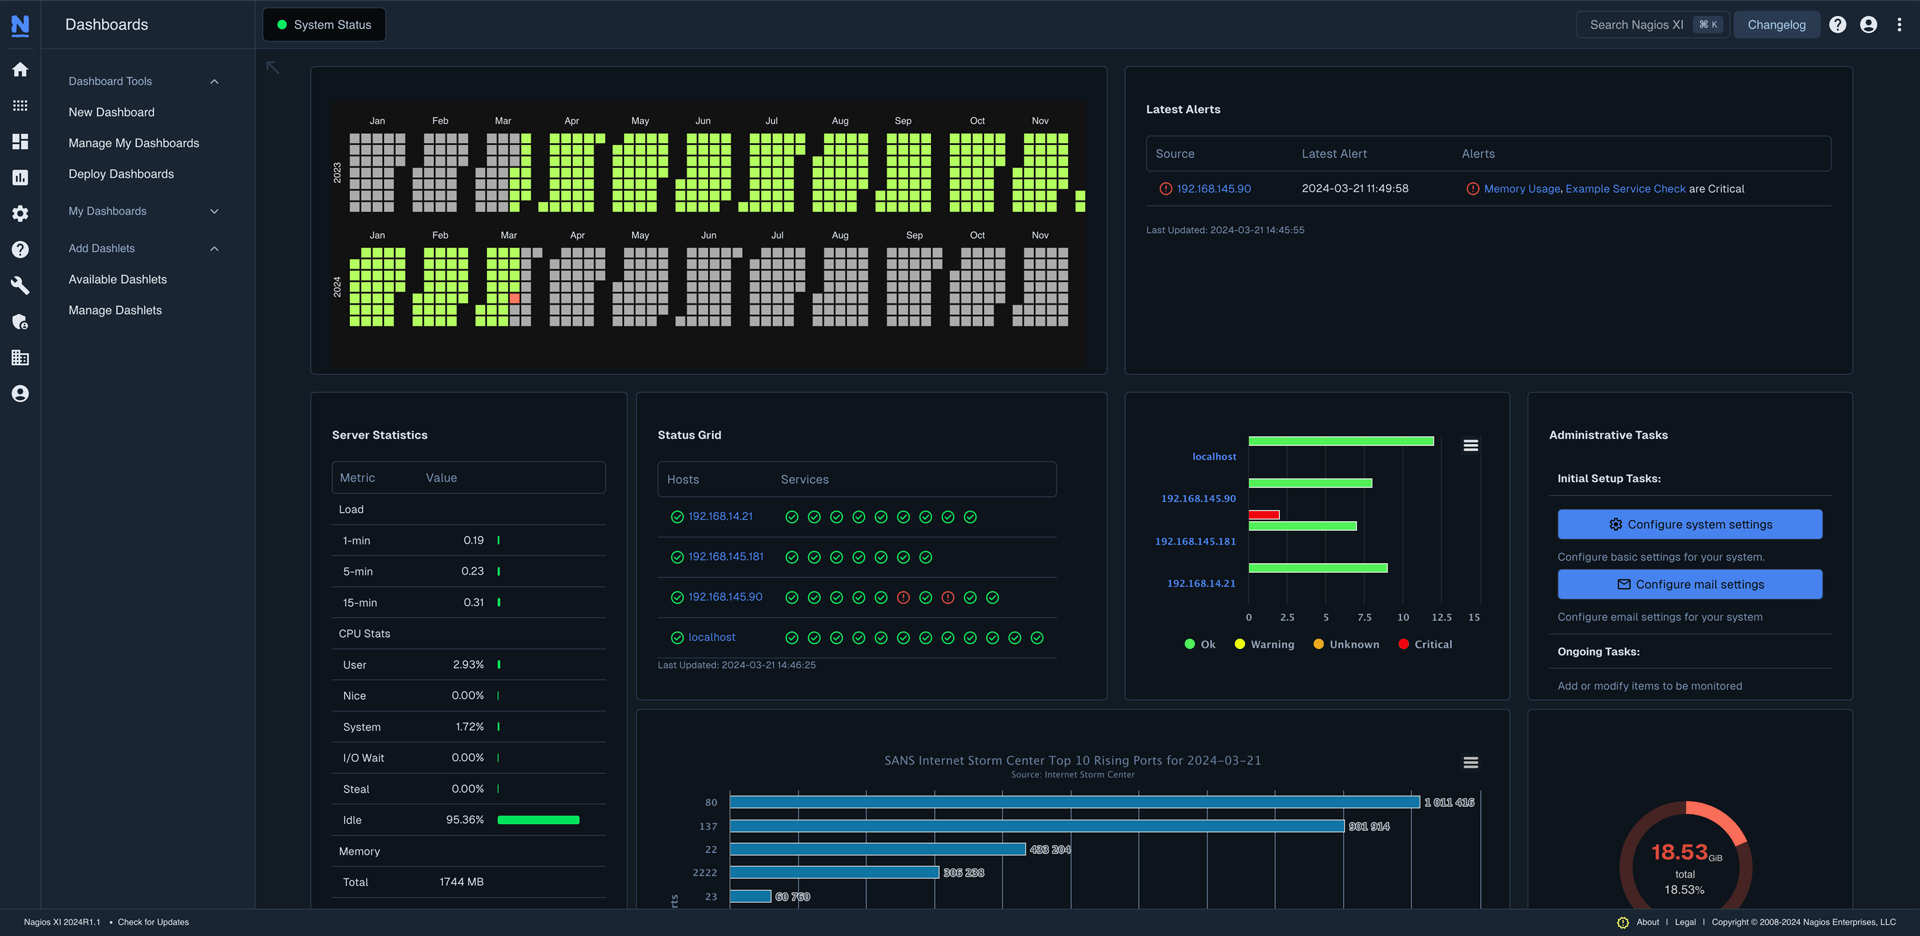
Nagios is a powerful IT infrastructure monitoring tool that helps organizations track system performance, detect anomalies, and prevent downtime. It provides a centralized view of servers, networks, applications, and databases, making it an ideal solution for businesses that require in-depth IT monitoring and proactive alerting.
Key features
Full-Scale IT Infrastructure Monitoring
- Tracks server health, network devices, applications, and cloud services.
- Monitors CPU usage, RAM utilization, disk space, and performance trends.
Real-Time Alerts & Notifications
- Customizable alerts ensure IT teams are informed before issues escalate.
- Multi-channel notifications via email, SMS, and third-party integrations.
Robust Reporting & Analytics
- Detailed performance reports help in troubleshooting and capacity planning.
- Visual dashboards provide a clear snapshot of infrastructure health.
Extensive Plugin Support & Community-Driven Ecosystem
- Over 5,000 plugins allow monitoring of nearly any IT component.
- Strong community support ensures ongoing enhancements and compatibility.
10. AppDynamics
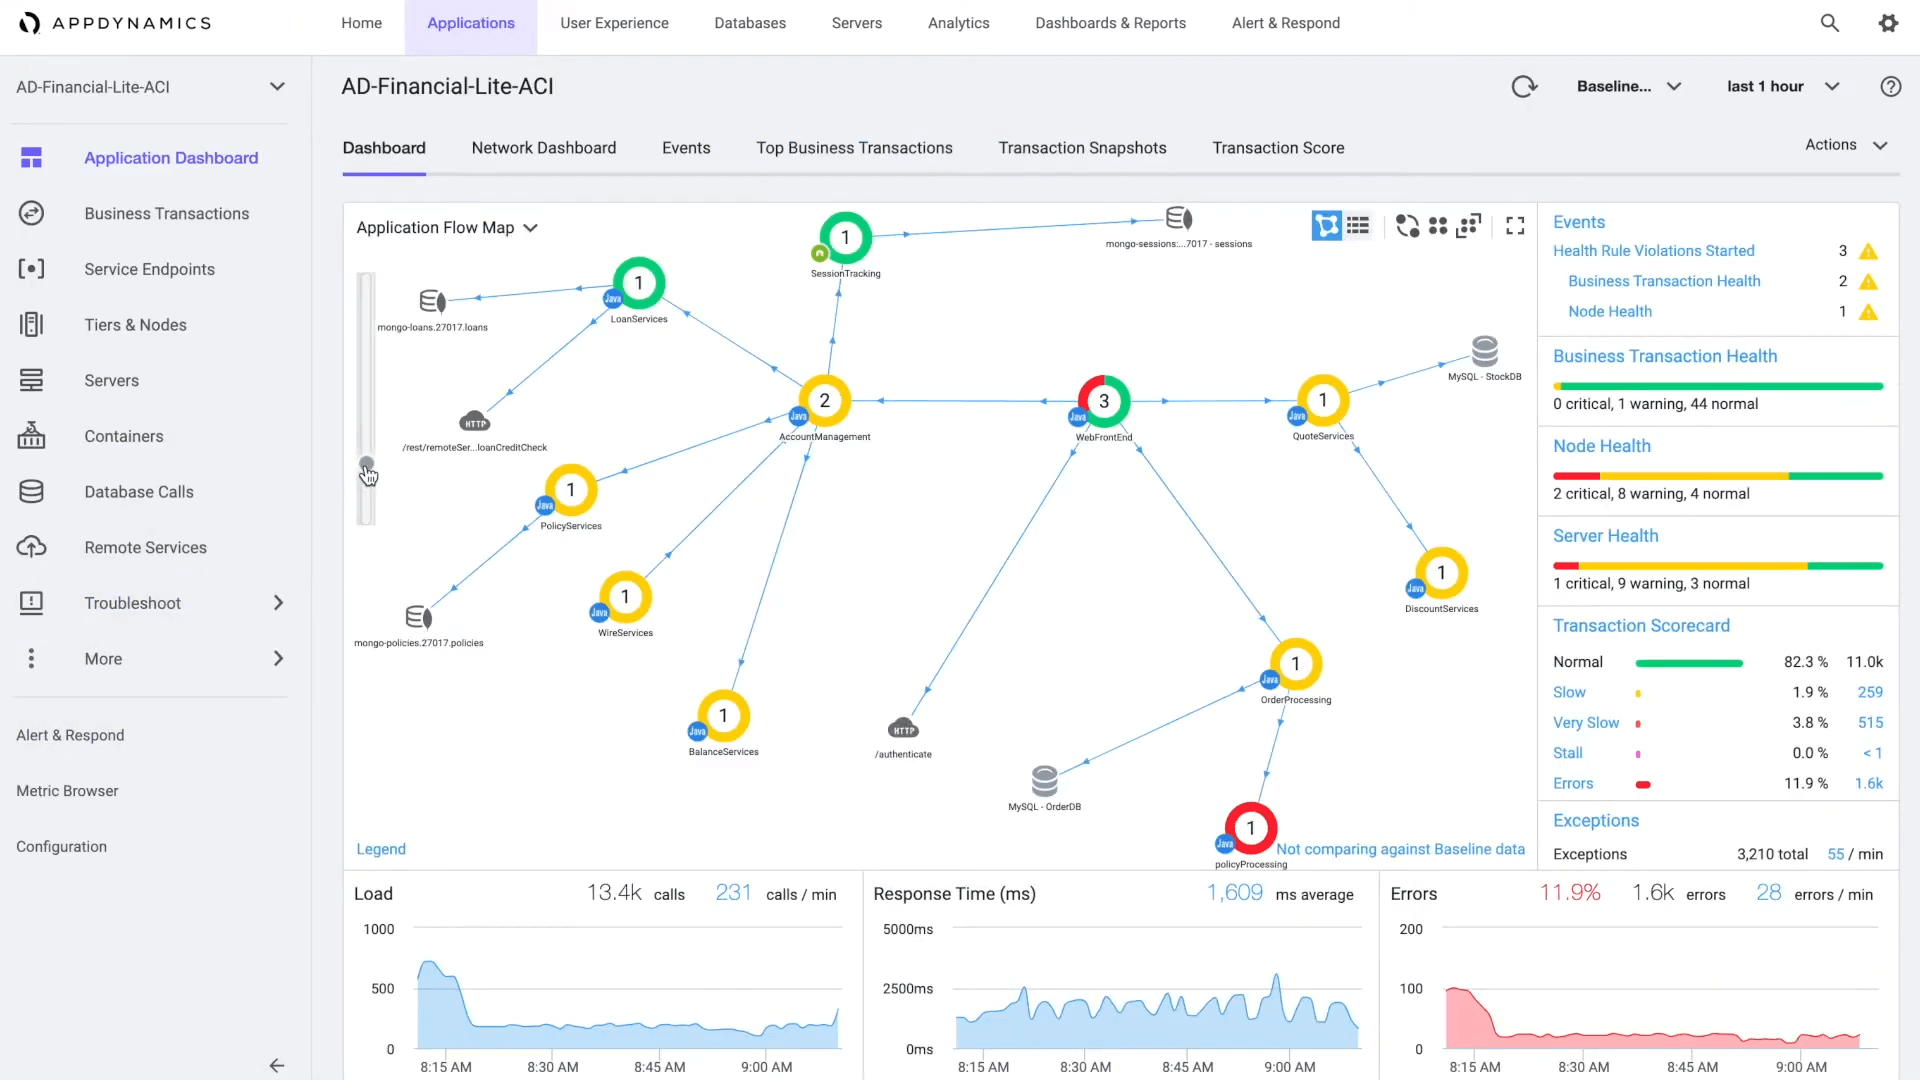
AppDynamics is an advanced application performance monitoring (APM) solution that helps businesses track, analyze, and optimize application performance in real-time. Its end-to-end business transaction tracing ensures organizations gain full visibility into how applications impact user experience and business outcomes.
Key features
Business Transaction Tracing & Real-Time Analytics
- Tracks every step of a transaction across distributed systems.
- Helps pinpoint bottlenecks, slow queries, and inefficient code execution.
Intelligent Performance Monitoring & Anomaly Detection
- Uses AI-driven anomaly detection to identify issues before they impact users.
- Dynamic baselining adjusts performance thresholds based on real-time behavior.
Deep Infrastructure & Cloud Monitoring
- Provides full visibility across on-prem, cloud, and hybrid environments.
- Monitors servers, containers, databases, and microservices for holistic insights.
Robust Integrations with Leading Platforms
- Supports integrations with AWS, Azure, Kubernetes, and database technologies.
- Works with DevOps and CI/CD pipelines for seamless deployment monitoring.
SaaS Monitoring Best Practices
To maximize the effectiveness of your SaaS monitoring efforts, follow these best practices:
- Set Up Real-Time Alerts – Get notified instantly when an issue arises to minimize downtime.
- Monitor Multiple Status Pages – Use status page monitoring to track SaaS provider outages that may impact your business.
- Implement Synthetic Monitoring – Simulate user interactions to detect performance issues before they affect customers.
- Analyze Historical Data – Use past performance data to identify recurring issues and optimize performance.
- Ensure Compliance & Security – Continuously monitor SaaS applications for security vulnerabilities and compliance requirements.
- Integrate with ITSM & DevOps Tools – Connect your monitoring tool with platforms like Jira, PagerDuty, and Slack for seamless incident management.
How to Monitor SaaS Applications Effectively
- Choose the right SaaS monitoring software – Consider features like API monitoring, status aggregation, and alerting capabilities.
- Define key performance indicators (KPIs) – Track essential metrics such as uptime, latency, and user experience.
- Set automated response mechanisms – Use AI-driven alerts and automated workflows to speed up incident resolution.
- Regularly review and optimize monitoring strategies – Ensure your monitoring setup evolves with changing business needs and application landscapes.
Make sure to check out the full guide on SaaS web application monitoring best practices in one of our previous blogs.
Final Thoughts
SaaS monitoring tools play a crucial role in ensuring the stability, performance, and security of cloud applications. Whether you need status page aggregation, real-time alerting, or full-stack observability, the tools listed above provide robust solutions for monitoring SaaS applications effectively.
By implementing SaaS monitoring best practices, IT teams can proactively identify issues, optimize performance, and deliver a seamless user experience. Choose the right monitoring tool for your organization and keep your cloud-based services running smoothly.

FAQ: SaaS Monitoring Tools
What is the best SaaS monitoring tool?
The best SaaS monitoring tool depends on your specific needs. Popular options include StatusGator for status aggregation, New Relic for full-stack observability, and Datadog for real-time performance tracking. Choose a tool based on your organization’s monitoring requirements, integrations, and budget.
What is a SaaS monitoring tool?
A SaaS monitoring tool tracks the availability, performance, and security of cloud-based applications. These tools provide real-time alerts, detailed insights, and historical data to help IT teams detect issues early, optimize performance, and ensure a seamless user experience.
How can I monitor SaaS apps I rely on?
You can monitor SaaS apps by using tools like StatusGator, which aggregates the status pages of third-party services, or full-stack monitoring solutions like New Relic and Datadog. These platforms provide uptime tracking, performance analytics, and alerting features to help you stay informed about any disruptions.
Can I create custom monitors for specific features of my SaaS platform?
Yes, you can set up custom monitors for critical features that your users depend on. This allows you to give customers detailed updates on the status of these features, particularly if they’re impacted during maintenance or unexpected incidents.
How do you monitor SaaS?
SaaS monitoring is done by tracking application performance, uptime, and key infrastructure metrics using monitoring tools. These tools integrate with SaaS platforms to provide real-time insights, send automated alerts for issues, and generate reports on overall system health.