StatusGator notifies you when status pages change. But the most overlooked feature of it might just be the unified status page that displays the status of every service you depend on. This can save precious minutes during a frantic incident response.
An Idea Is Born
The original idea of StatusGator was born out of a day of frustration. After spending hours debugging a problem with a client’s production deployment, I discovered that an API we depended on was having an intermittent outage. The provider had posted about it on their status page, but I hadn’t thought to check there first. The idea was simple: a way to get notified of changes to status pages.
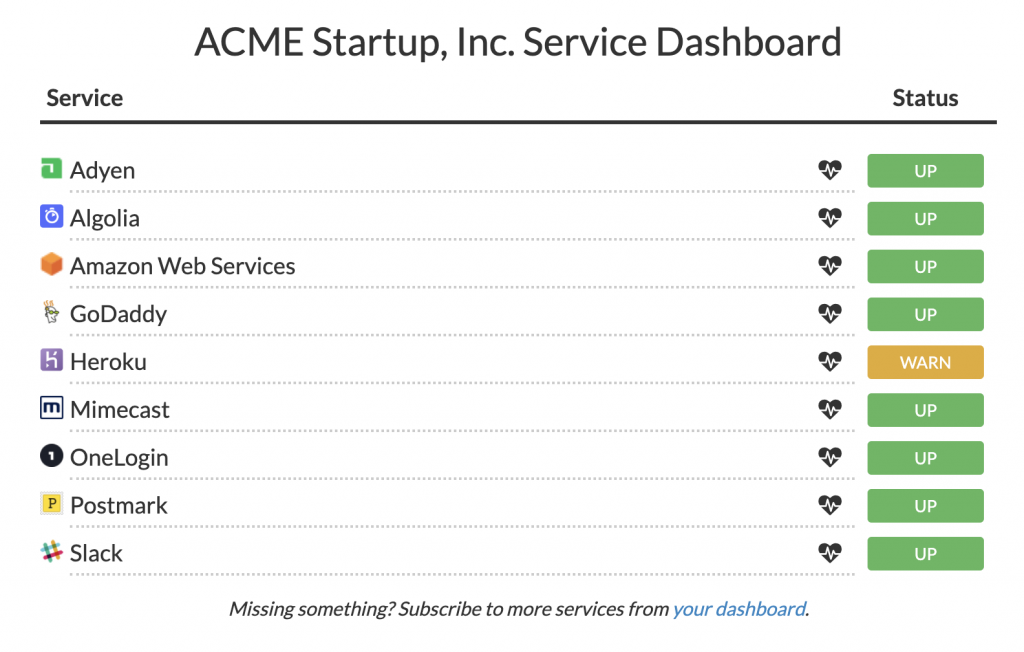
But I quickly discovered that another useful capability would be a unified dashboard showing all the dependencies we relied on. Whenever a problem arose, I could check this page and see if any service had posted an outage. By aggregating the status of all of our dependencies, we’d have a single place to check first before beginning any debugging process.
This feature became a centerpiece of the service and inspired its name: StatusGator, the status aggregator.
Getting the Most Out of StatusGator
Adding all your dependencies is the first step to creating a useful and comprehensive dashboard. Simply search through our 2,800+ services to find those you subscribe to. (If we are missing a status page you need, just ask!) We recommend thinking about each major category:
- hosting or cloud provider
- database hosts
- content delivery network (CDN)
- customer service, ticketing, and telephony tools
- email provider
- chat service
- continuous integration (CI) service
- logging or exception-handling service
- third-party APIs
When adding each service to your StatusGator status page, you can decide if the service is critical enough to warrant proactive notifications. For ultra-critical services, specify the “warm” status level, ensuring you receive all changes to each page. Less critical services might warrant the “down” level to receive only the highest severity changes. For internal tools and other non-business-critical services, notifications are probably not necessary.
Lastly, consider setting up component status filtering for services with many components or regions. This feature allows you to restrict notifications to status page changes that include the specific components you rely on. For example, Amazon S3 in the US West region only.
Publish Your Internal Page
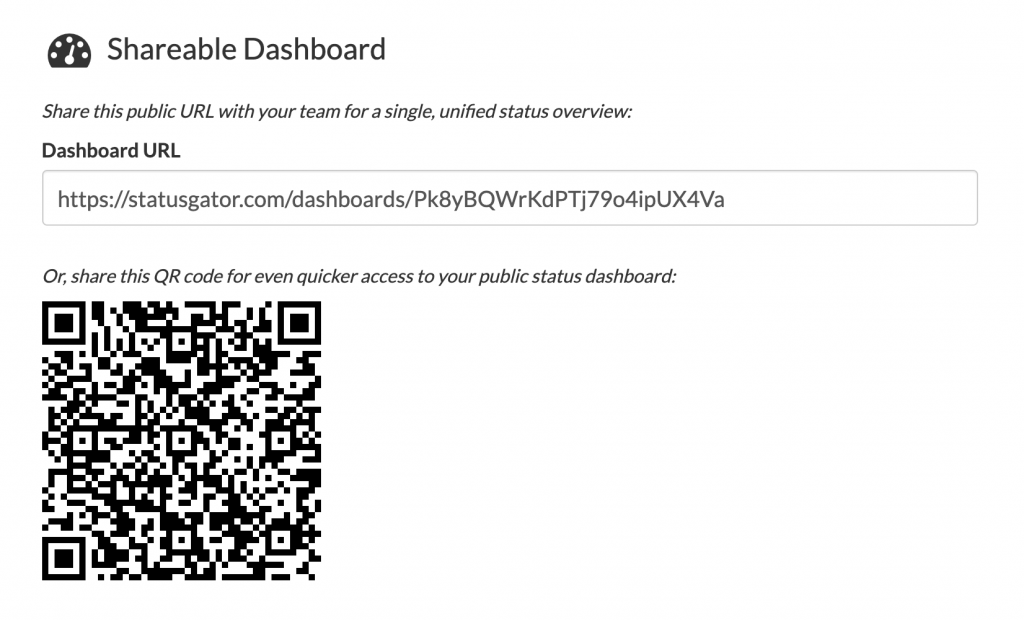
For your unified status page to be useful, you need to disseminate it to your team. StatusGator makes this easy with a unique tokenized URL for each account that provides read-only access to your dependency list. You can get this URL on your Notifications page. It’s critical that this page be a prominent part of your incident response process.
Some StatusGator customers have shared that they prominently feature the status page URL at the top of their incident response documentation, and provide it to every on-call engineer for quick access. Some also integrate their dashboard data into PagerDuty, Datadog, and other monitoring tools.
The Future
Our goal at StatusGator has always been to make the status data you rely on available in every channel on every platform. In addition to the web-based dashboard, we also have a JSON endpoint for reading your dependency status. Where else would you like to have access to it? We thrive on feedback, so email us.
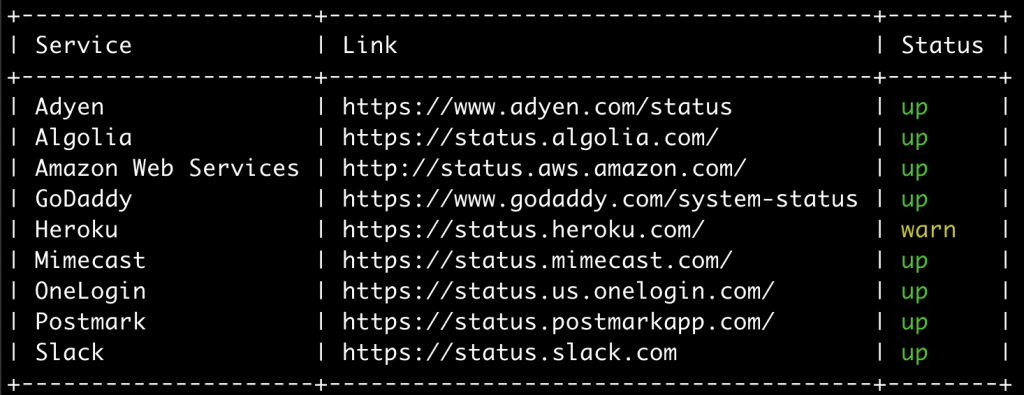
One concept in our pipeline is a command line interface for StatusGator. Through a simple CLI, you and your team could see the status of all your dependent status pages right in your terminal. Would this be useful to you? Let us know! Would access in Slack or Microsoft Teams be more useful? Have third-party tools you need StatusGator to work with? Reach out and help us decide the direction of the product!