Uptime reports are now available through the StatusGator v3 API.
This new endpoint provides the same uptime report data available in the StatusGator UI, making it easy to access uptime statistics programmatically through the API and MCP server.
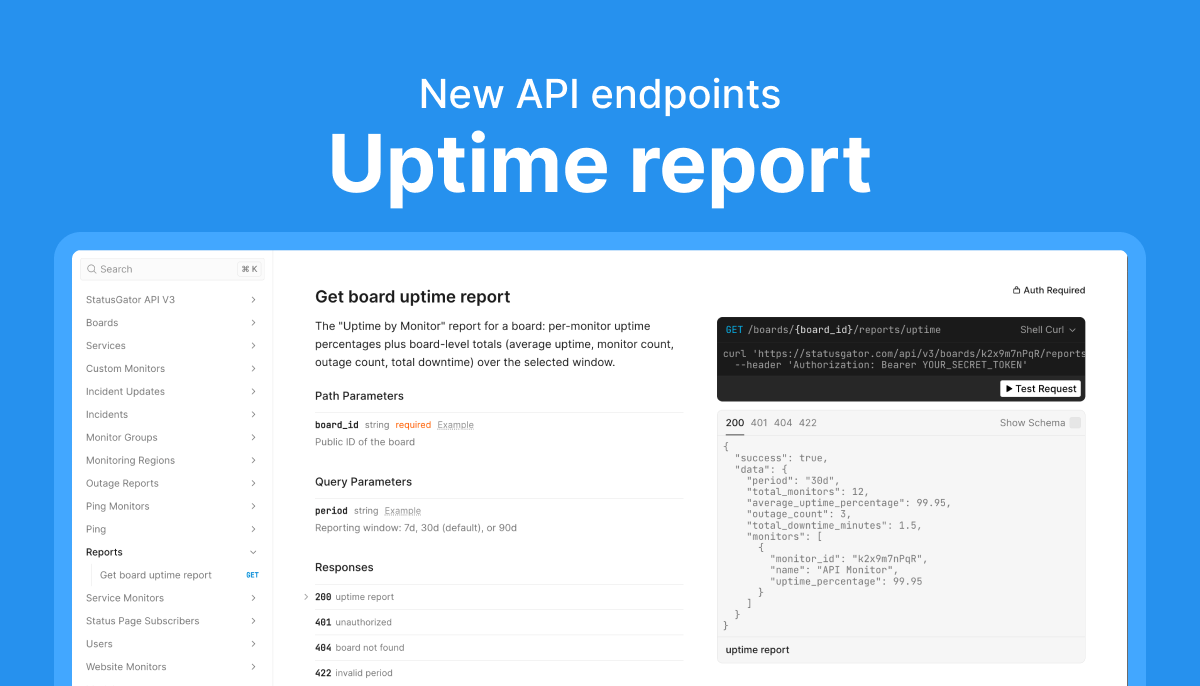
You can find the endpoint in the API documentation
New endpoint

GET /api/v3/boards/{board_id}/reports/uptime
What’s included
The endpoint returns an uptime report for a board, including:
- Average uptime percentage across all monitors
- Total number of monitors
- Outage count
- Total downtime minutes
- Per-monitor uptime percentages
Example response:
{
  "success": true,
  "data": {
    "period": "30d",
    "total_monitors": 67,
    "average_uptime_percentage": 98.8,
    "outage_count": 203,
    "total_downtime_minutes": 8074.3,
    "monitors": [...]
  }
}
The response follows the standard v3 API format, with report data nested under data.
Supported periods
Use the period query parameter to generate reports for:
7d30d(default)90d
MCP and automation use cases
Because this endpoint is automatically available through the MCP server, AI agents and integrations can use uptime report data without needing access to the StatusGator UI.
Examples include:
- Generating uptime reports for customers and stakeholders
- Tracking reliability trends over time
- Identifying services with the lowest uptime
- Including uptime metrics in automated reporting workflows
Implementation details
- Reuses the existing uptime report data source used by the StatusGator UI
- Added under a new
Reportsnamespace in the v3 API - Automatically included in the OpenAPI specification, Scalar documentation, and MCP server
Verification
Coverage was added in uptime_report_spec.rb and includes:
200 OK401 Unauthorized404 Not Found
Looking ahead
The new Reports namespace provides a foundation for exposing additional report types through the API. By making uptime reports available through both the v3 API and MCP server, StatusGator data becomes easier to integrate into reporting, automation, and AI-powered workflows.