GitHub outage on April 23, 2026

Read more >

Introducing StatusGator’s Accessibility Conformance Report (VPAT)

Read more >

StatusGator logo
Schedule a Demo
StatusGator logo
Use cases

IT Teams

Stay informed of outages and reduce tickets

DevOps

One status page for all your providers

Features designed specifically for K12

Advanced features designed for enterprise

Impress clients with proactive monitoring

Analyze and compare peer performance

Monitor dependencies to prevent revenue loss

Create and manage custom status pages for your product

Features

Status page

A status page with service, website, and custom monitors built-in

Status aggregation

Aggregate the status of all vendors to a single page

Monitor all your cloud services from a single dashboard

Monitor your website with uptime monitoring built-in

Monitor network connectivity

Control the status of custom monitors manually with incidents

Get notified of disruptions before they become public

Pricing

Business

From startup to enterprise and everything in between

Education

Special plans and discounts for K12 and higher ed

Integrations

Incident Management

Better Uptime
FireHydrant
Opsgenie
PagerDuty

Notifications

Private Status

AT&T status
AWS status
Azure status
Microsoft 365 status
Zendesk status

Status Pages

Atlassian Statuspage
StatusHub

Advanced

Sign In Sign Up

Monitor metrics now available in the v3 API

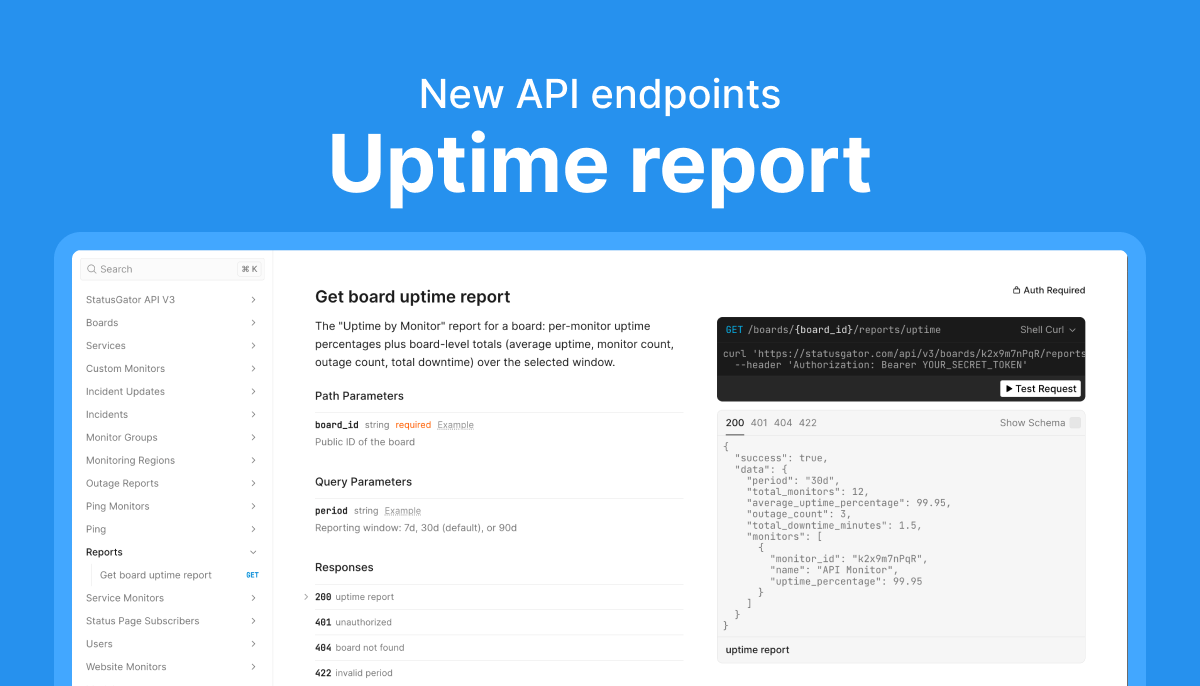
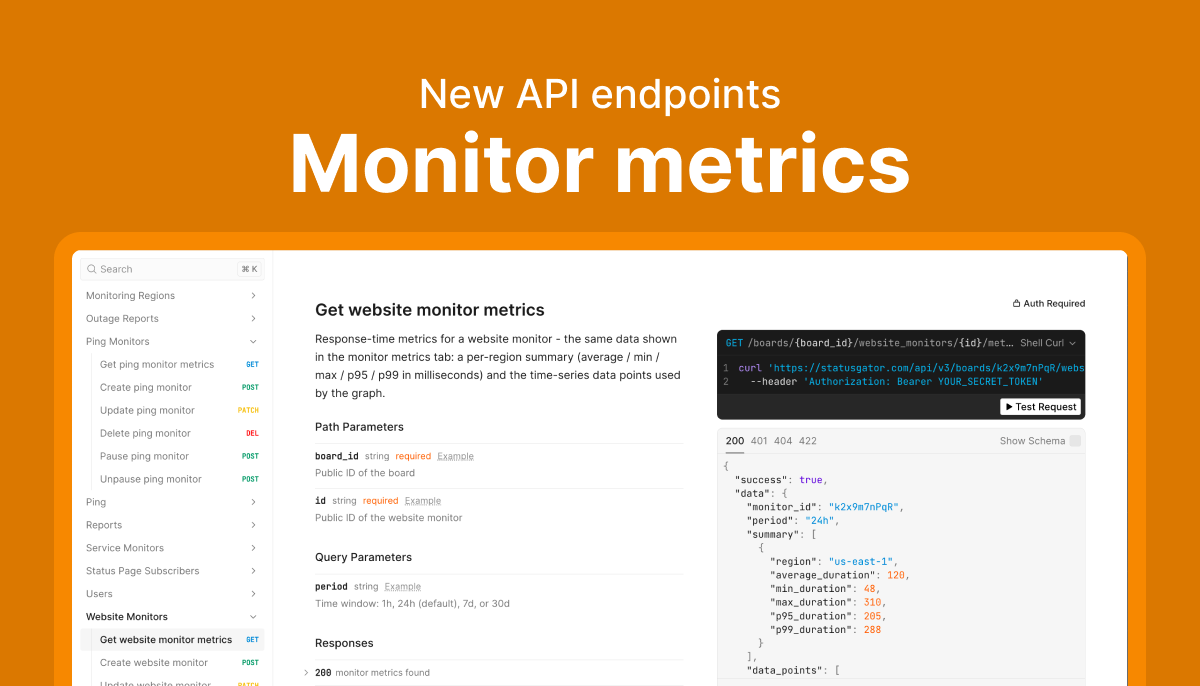
Monitor metrics are now available through the StatusGator v3 API for both Website Monitors and Ping Monitors.

These endpoints provide the same latency and performance data available in the Monitor Metrics tab, making it accessible through the API and MCP server.

You can find the endpoints in the API documentation:

What’s included

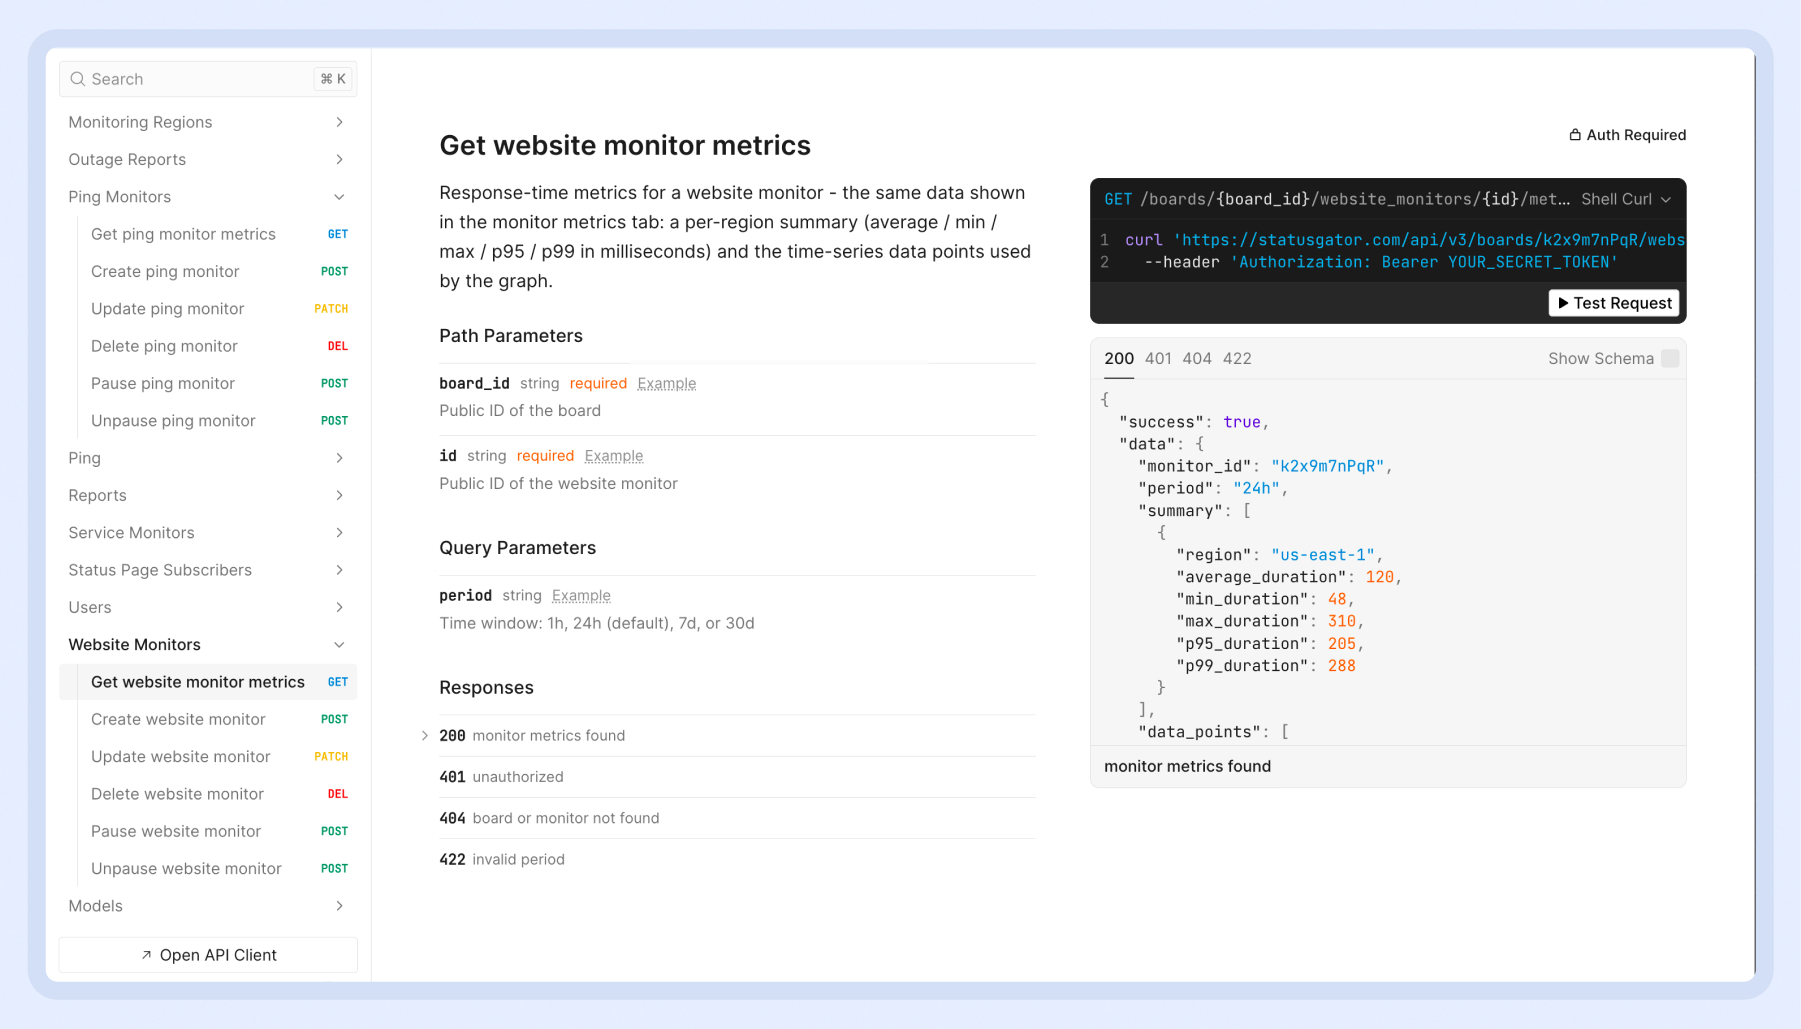
The endpoints return:

  • Regional latency summaries
  • Average, minimum, and maximum response times
  • p95 and p99 latency metrics
  • Historical time-series data used to power the Metrics tab charts

Example response:

{
  "success": true,
  "data": {
    "monitor_id": "5lo4QZnCRf",
    "period": "24h",
    "summary": [...],
    "data_points": [...]
  }
}

Supported periods

Use the period query parameter to retrieve metrics for:

  • 1h
  • 24h (default)
  • 7d
  • 30d

MCP and automation use cases

Because these endpoints are automatically available through the MCP server, AI agents and integrations can access monitor performance data directly.

Examples include:

  • Investigating monitor failures
  • Identifying latency spikes
  • Detecting regional performance issues
  • Including performance metrics in automated reporting and workflows

Looking ahead

Making monitor metrics available through the v3 API and MCP server gives developers, integrations, and AI agents access to the same performance insights available in the StatusGator UI, enabling richer monitoring and automation workflows.

Share this

Photo of author

Colin Bartlett

Colin Bartlett is co-founder of StatusGator and Nimble Industries, a seasoned Ruby engineer and entrepreneur who launched StatusGator in 2015 and later grew it into a full-fledged company.