21,228 outages in February - Here are the biggest:

Stay informed with our real-time outage map, showcasing regions that have experienced service issues or possible disruptions in the last 24 hours.
YCharts not working for you?
YCharts not working for you?
Our outage detection system continuously monitors multiple data sources to identify disruptions in YCharts services. We collect user reports, track YCharts's official status pages, and run automated API checks to verify service availability. Additionally, we integrate data from third-party monitoring tools and use AI-powered anomaly detection to analyze traffic patterns and error reports, identifying outages even before they are officially acknowledged. All this data is aggregated into our real-time heatmap, visually highlighting affected regions— with darker red areas indicating more severe disruptions.
Looking for more YCharts outage stats?
Get real-time insights and historical data on YCharts outages.
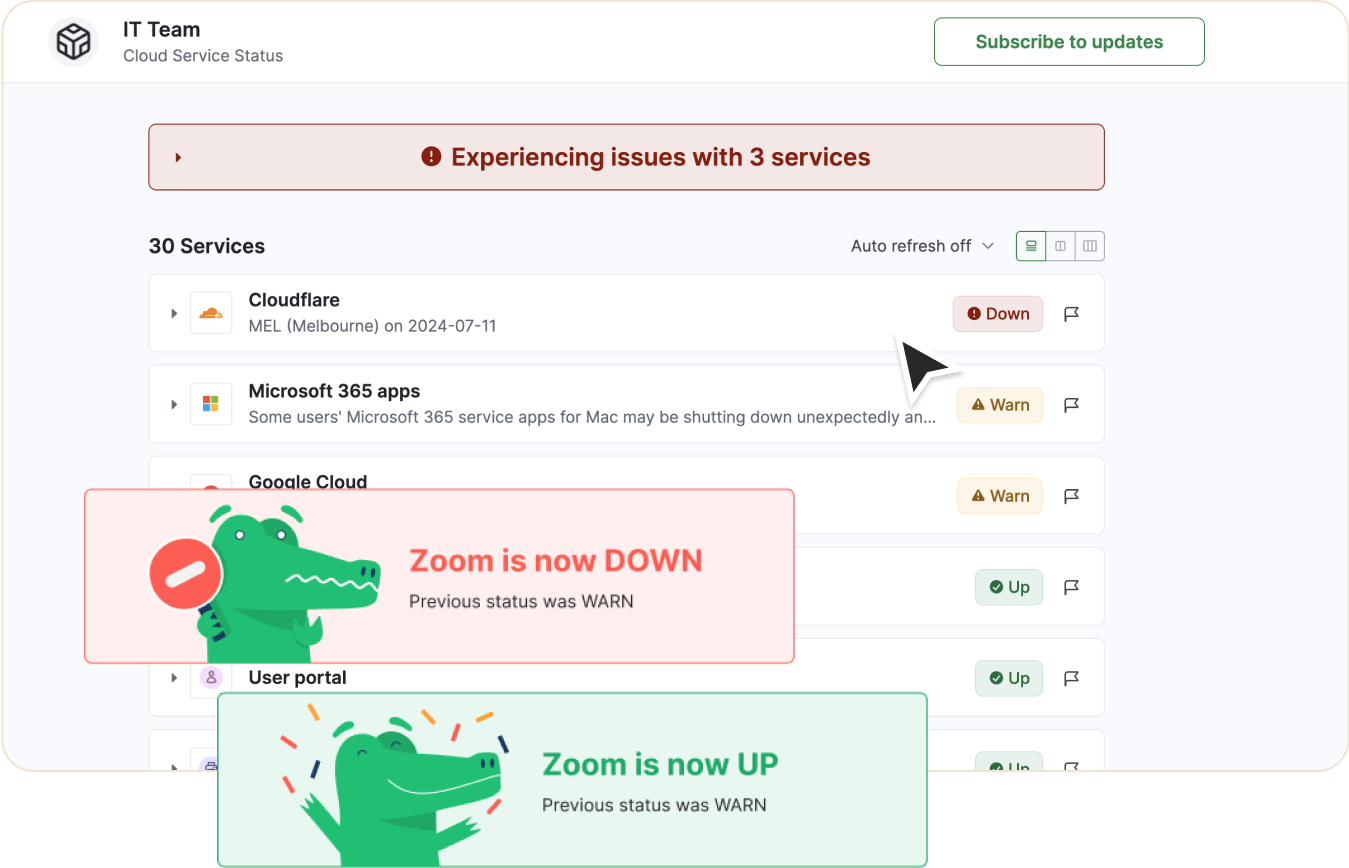
StatusGator monitors all your cloud services and websites, notifies you before official status pages do, and helps you communicate outages to reduce support tickets.