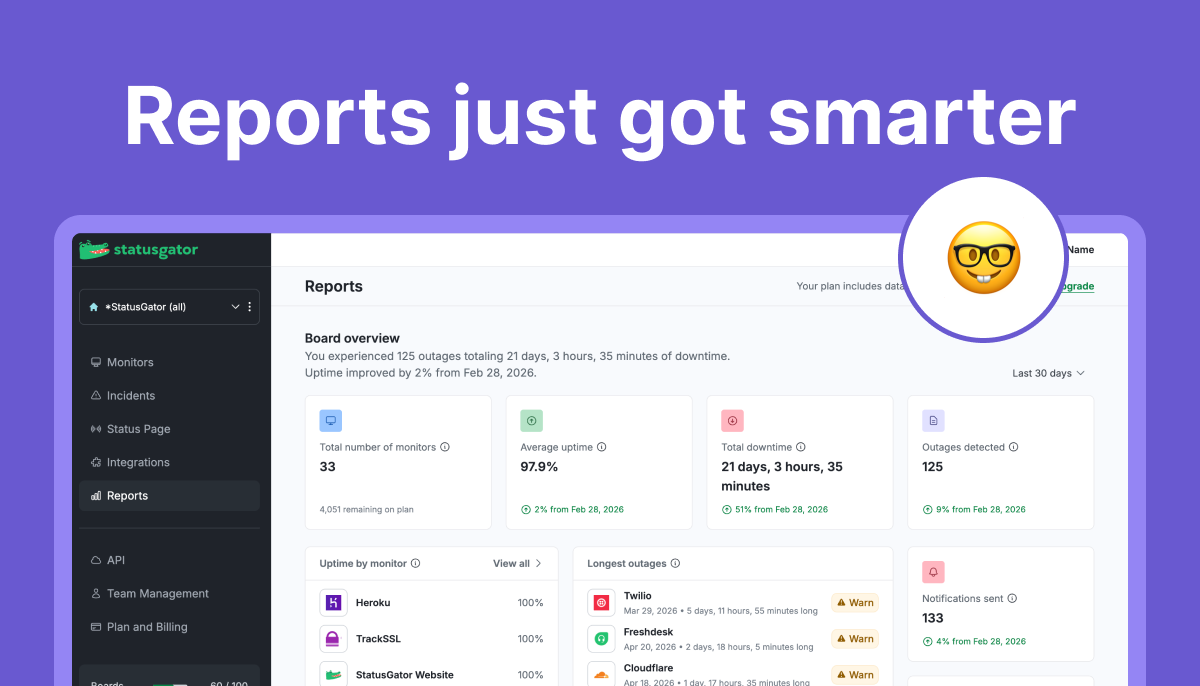
We’ve upgraded the Reports page in StatusGator to give you more insight directly inside the StatusGator dashboard. Previously, reporting was limited to exports you could use to calculate your own uptime percentages and trends.
Now, in addition to exported reports, you can view key reports and metrics without needing to download anything. We’ve also added a one-click download of the most commonly requested report: Uptime percentage by monitor.
A more complete reporting experience
The Reports page now brings together high-level insights, performance summaries, outage tracking, and exports in one place. You can quickly understand how your services are performing across several time ranges like the last 7, 30, or 90 days.
Built-in reports and insights

Board overview
See a snapshot of your board with metrics like total monitors, average uptime, total downtime, and outages detected. Trend indicators help you quickly understand whether things are improving or declining.
Uptime by monitor
View uptime performance for each service at a glance. This makes it easier to spot reliable services and identify ones that may need attention.
Longest outages
Track your most significant incidents with details on duration, timing, and severity. This helps you focus on the outages that had the biggest impact.
Notifications and Early Warning Singals
Get visibility into how your alerting is performing with metrics like notifications sent and Early Warning Signals detected.
Reminder
Don’t forget you can apply Component filters to focus on specific parts of your services. Not only will this help reduce notification noise about irrelevant components, but reports will update in real time, ensuring more accurate historical data.
Exported reports
Exported reports are still available and unchanged. These include board history, all status changes, component status changes, and component summaries. They remain useful for sharing, audits, and deeper analysis.
What’s next?
The Reports page is now a central place for both quick insights and detailed data. You can monitor trends, investigate issues, and make decisions without needing to export first. We’d love your feedback on these reports: Any issues or questions about the data? What improvements would you like to see? Would more granular control over the time range be helpful? Let us know! Reach out to our team.