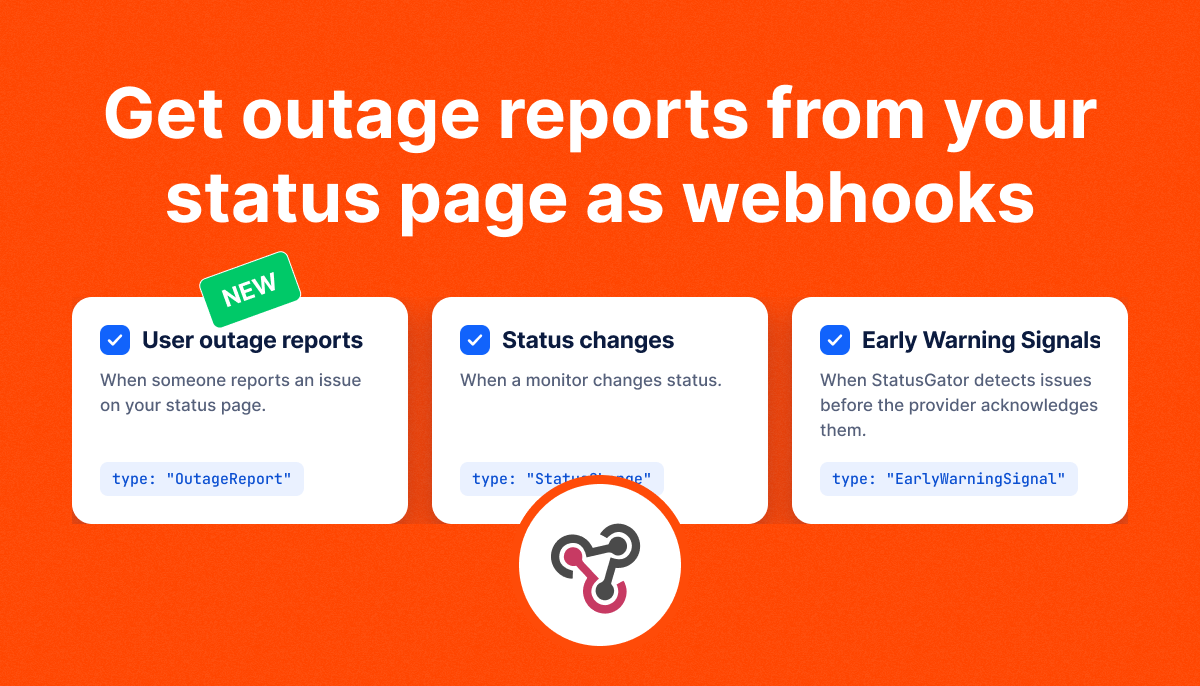
StatusGator webhooks now support user outage reports, so you can send reports from your status page to your own tools as soon as they’re confirmed. We’ve also added event settings to each webhook, letting you choose which notifications an endpoint receives.
Use outage reports to create support tickets, alert your on-call team, or collect reports for analysis. Each payload includes the affected service, selected components, the reporter’s comment, and their approximate location.
Choose which events to receive
Each webhook now has three event options:
| Event | When it’s sent | Payload type |
|---|---|---|
| User outage reports | Someone reports an issue on your status page and the report is confirmed. | OutageReport |
| Status changes | A monitor changes status. | StatusChange |
| Early Warning Signals | StatusGator detects an issue before the provider acknowledges it. | EarlyWarningSignal |
New webhooks have all three events enabled by default. Existing webhooks continue receiving status changes and Early Warning Signals. To receive outage reports too, enable User outage reports in the webhook’s settings.
You can also use separate endpoints for different events. For example, send outage reports to your support system and status changes to your incident management tool.
Enable outage report webhooks
- Open the board associated with your status page.
- Go to Integrations → Webhook.
- Select User outage reports and any other events you want to receive.
- Save your settings.
The next confirmed report submitted through that board’s status page will be sent to your endpoint. Outage reports use your existing signing secret, custom headers, delivery logs, and retries.
Example payload
Outage reports arrive as HTTP POST requests with a JSON body. They always use the v3 format, regardless of the version selected in your webhook settings.
POST https://your-endpoint.example.com/statusgator
Content-Type: application/json
X-Webhook-Version: 3.0
X-Signature: 5d1c0b6e…
{
"type": "OutageReport",
"recorded_at": "2026-10-15T14:22:09Z",
"board": {
"id": "X1iMbb5HTm",
"name": "Production"
},
"id": "lpZ4nQy7Hk",
"service": {
"id": "OUQJLhNcSb",
"name": "OpenAI",
"icon_url": "https://favicons.statusgator.com/openai.png",
"official": true
},
"monitor": {
"id": "UIMPLWZg9D",
"name": "OpenAI",
"monitor_type": "ServiceMonitor",
"icon_url": "https://favicons.statusgator.com/openai.png"
},
"summary": {
"id": "5rX2kQ",
"description": "Service down"
},
"comment": "I can't reach ChatGPT.",
"email": "reporter@example.com",
"components": [
{
"id": "9aB3cD1eFg",
"name": "Chat",
"group_name": "APIs"
}
],
"location": {
"city": "Seattle",
"region": "Washington",
"country": "United States",
"country_code": "US"
},
"confirmed_at": "2026-10-15T14:22:09.123Z",
"created_at": "2026-10-15T14:20:51.880Z"
}Payload schema
Report fields appear directly in the JSON body. The payload matches the object returned by the outage reports API, with three additional fields: type, recorded_at, and board.
| Field | Type | Description |
|---|---|---|
type | string | Always "OutageReport". |
recorded_at | string | When the report was confirmed, in ISO 8601 UTC format. |
board | object | The board whose status page received the report. |
board.id | string | Public ID of the board. |
board.name | string | Name of the board. |
id | string | Public ID of the outage report. |
service | object | The service being reported. |
service.id | string | Public ID of the service. |
service.name | string | Name of the service. |
service.icon_url | string or null | URL of the service icon. |
service.official | boolean | Whether this is an official StatusGator service. |
monitor | object or null | The monitor on your board for this service. null if the board no longer has it. |
monitor.id | string | Public ID of the monitor. |
monitor.name | string | Display name of the monitor. |
monitor.monitor_type | string | One of ServiceMonitor, WebsiteMonitor, PingMonitor, or CustomMonitor. |
monitor.icon_url | string or null | URL of the monitor icon. |
summary | object or null | The problem category, selected by the reporter or derived from their comment. |
summary.id | string | ID of the category. |
summary.description | string | Name of the category, such as "Service down". |
comment | string or null | The reporter’s description of the problem. |
email | string or null | The reporter’s email address, or null if none was provided. |
components | array | Components the reporter marked as affected. May be empty. |
components[].id | string | Public ID of the component. |
components[].name | string | Name of the component. |
components[].group_name | string or null | The component’s group. |
location | object | The reporter’s approximate location, determined from their IP address. |
location.city | string or null | City. |
location.region | string or null | Region or state. |
location.country | string or null | Country name. |
location.country_code | string or null | ISO 3166-1 alpha-2 country code, such as "US". |
confirmed_at | string | When the report was confirmed, in ISO 8601 format. |
created_at | string | When the report was submitted, in ISO 8601 format. |
The reporter’s IP address is never included in the payload.
Verify incoming requests
Every request includes an X-Signature header containing the hex-encoded HMAC-SHA256 signature of the raw request body, generated using your webhook’s signing secret.
Before processing a report, calculate the signature on your server and compare it with the header. Use the raw body before JSON parsing.
Here’s a Node.js example:
const crypto = require("crypto");

function verify(rawBody, signature, secret) {
  if (
    typeof signature !== "string" ||
    !/^[a-f0-9]{64}$/i.test(signature)
  ) {
    return false;
  }

  const expected = crypto
    .createHmac("sha256", secret)
    .update(rawBody)
    .digest();

  const received = Buffer.from(signature, "hex");

  return crypto.timingSafeEqual(received, expected);
}
Fetch outage reports through the API
If your workflow checks for reports on a schedule, you can use the new outage reports endpoint:
GET /api/v3/boards/{board_id}/outage_reports?since=2026-10-15T00:00:00ZThe endpoint returns confirmed reports, newest first, with 25 reports per page. Use the since parameter to retrieve reports confirmed at or after a specific ISO 8601 timestamp. Follow pagination to collect all matching reports.
Each report contains the same report fields as the webhook payload, without type, recorded_at, and board.
For more details, see the Webhook version 3.0 reference.
To get started, open Integrations → Webhook on your board and enable User outage reports.